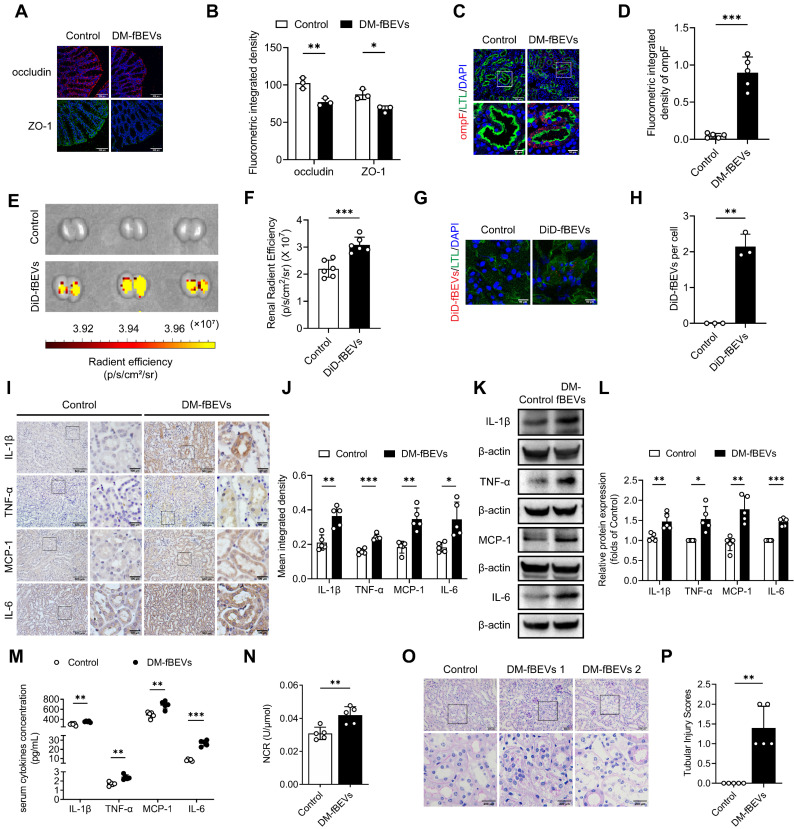
Figure 6.
Orally administered DM-fBEVs translocate into tubulointerstitium and induce tubulointerstitial inflammation and kidney injuries. (A-B) Expressions of tight junction proteins occludin (red) and ZO-1 (green) in mouse colon tissues were determined by immunofluorescence staining and quantified (n=3). Nuclei were stained with DAPI (blue) (scale bar, 200 μm, original magnification × 400). (C-D) The presence of ompF+ OMVs (red dots) in mouse tubulointerstitium marked with LTL (green) was determined by immunofluorescence staining and quantified (n=5). Nuclei were stained with DAPI (blue) (scale bar, 200 μm and 50 μm, original magnification × 400). (E-F) DiD-fBEVs biodistribution in kidney was assessed using an IVIS Spectrum Imaging System and quantified (n=6). (G-H) Renal DiD-fBEVs signals (red) were detected by confocal laser scanning microscopy and quantified (n=3). Proximal tubules were stained with LTL (green). Nuclei were stained with DAPI (blue) (scale bar, 50 μm, original magnification ×400). (I-J) Tubulointerstitial inflammation in mice was detected by immunohistochemical staining and quantified (n=5) (scale bar, 500 μm and 100 μm, original magnification × 200). (K-L) Expression levels of inflammatory proteins in mouse renal cortex were detected by Western blot analysis (n=5). (M) Concentrations of serum cytokines, including IL-1β, TNF-α, MCP-1 and IL-6, were measured by the Luminex assay (n=5). (N) Urinary NCR was measured in mice (n=5). (O-P) Tubular pathological injuries were detected by PAS staining (scale bar, 500 μm and 200 μm, original magnification × 400) and quantified (n=5). DM-fBEVs 1 and 2 indicate images from two mice. *P < 0.05; **P < 0.01; ***P < 0.001.

