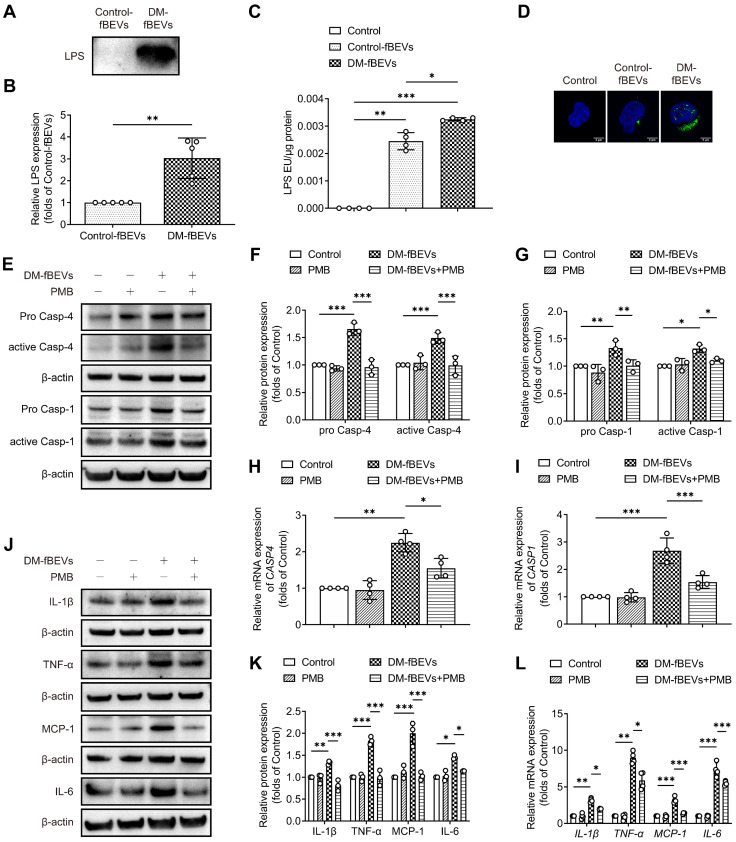
Figure 9.
OMVs-derived LPS contributes to tubulointerstitial inflammation. (A-B) LPS levels of the fBEVs lysates with the same protein level from different groups were measured by Western blot analysis of lipid A (n=5). HK-2 cells were treated without (Control) or with 5 μg/mL Control-fBEVs or DM-fBEVs for 24 h. (C) LPS levels in the cytosolic fractions of HK-2 cells were measured by the LAL assay (n=4). (D) LPS in HK-2 cells was visualized with an anti-lipid A antibody, shown in confocal laser scanning microscopy images (scale bar, 2 μm, original magnification × 1000). HK-2 cells were treated without (Control) or with 30 μg/mL PMB, 5 μg/mL DM-fBEVs or DM-fBEVs pretreated with PMB (DM-fBEVs+PMB) to neutralize LPS. (E-G) Protein expression levels of pro caspase-4, active caspase-4, pro caspase-1 and active caspase-1 were measured by Western blot analysis (n=3). (H-I) mRNA expression levels of CASP4 and CASP1 were measured by qRT-PCR analysis (n=4). (J-K) Protein expression levels of IL-1β, TNF-α, MCP-1 and IL-6 were measured by Western blot analysis (n=3). (L) mRNA expression levels of IL-1β, TNF-α, MCP-1 and IL-6 were measured by qRT-PCR analysis (n=4). *P < 0.05; **P < 0.01; ***P < 0.001.

