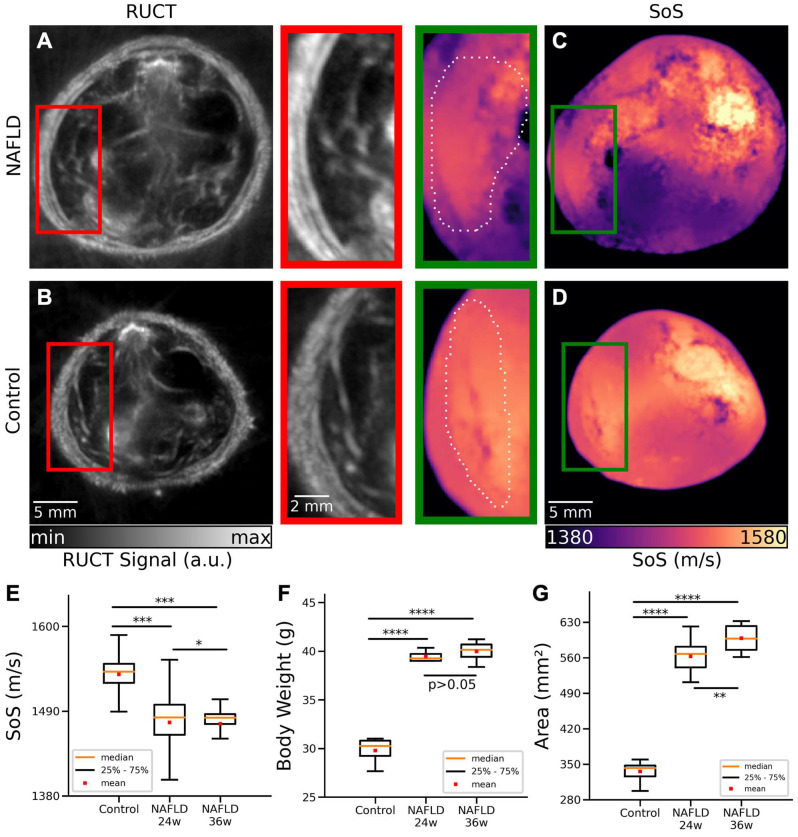
Figure 3.
Cross-sectional RUCT and SoS images of NAFLD and control mice in vivo. (A) RUCT image of a NAFLD mouse cross section. Zoom-in of the liver region is shown. (B) RUCT image of a control mouse cross section. Zoom-in of the liver region is shown. (C) SoS image of a NAFLD mouse cross section. Zoom-in of the liver region is shown. (D) SoS image of a control mouse cross section. Zoom-in of the liver region is shown. (E) Boxplots of the measured SoS values in the segmented liver regions for NAFLD vs control mice cross sections. (F) Boxplots of the measured body weights for NAFLD and control mice. (G) Boxplots of the measured cross-sectional areas for NAFLD and control mice. NAFLD 24 w: non-alcoholic fatty liver disease induced mice at 24 weeks of age; NAFLD 36 w: non-alcoholic fatty liver disease induced mice at 36 weeks of age; RUCT: reflection ultrasound computed tomography; SoS: speed of sound. (p values are indicated by * ≤ 0.05, ** ≤ 0.01 and *** ≤ 0.001, **** ≤ 0.0001).

