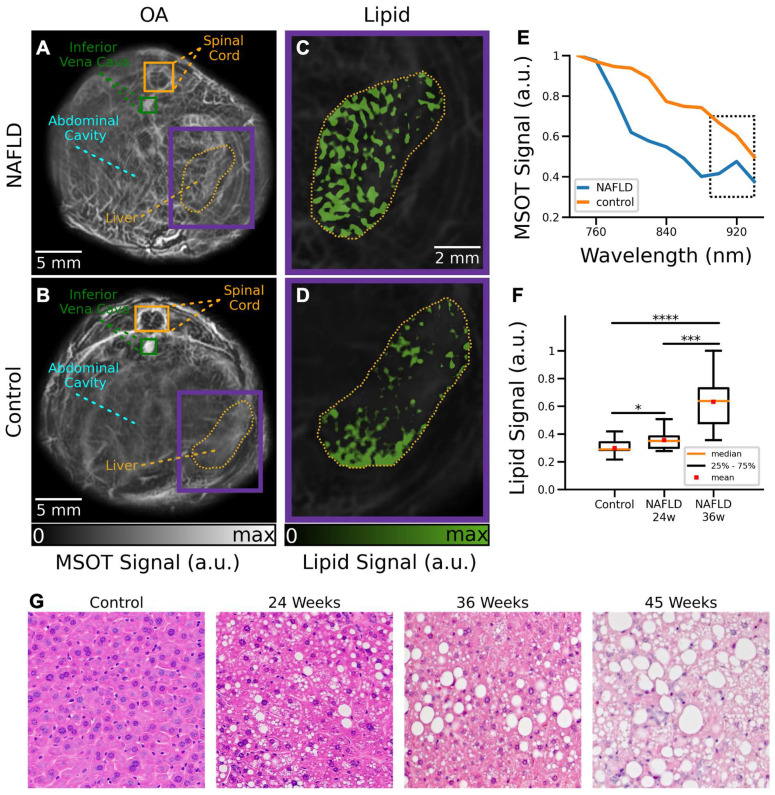
Figure 4.
Cross-sectional MSOT images of NAFLD and control mice in vivo. (A) Cross section of a NAFLD mouse. (B) Cross section of a control mouse. (C) The un-mixed bio-distribution of lipids within selected liver region is shown for NAFLD mouse. (D) The un-mixed bio-distribution of lipids is shown for control mouse. (E) Spectrum of the MSOT signals in liver region indicated in panels (A-B). (F) Boxplots of the lipid signals in the liver cross sections for all mice. MSOT: multispectral optoacoustic tomography; NAFLD 24w: non-alcoholic fatty liver disease induced mice at 24 weeks of age; NAFLD 36 w: non-alcoholic fatty liver disease induced mice at 36 weeks of age; (p values are indicated by * ≤ 0.05, ** ≤ 0.01 and *** ≤ 0.001, **** ≤ 0.0001). (G) Exemplary H&E staining histology images of a control mouse versus NAFDL mice at different stages.

