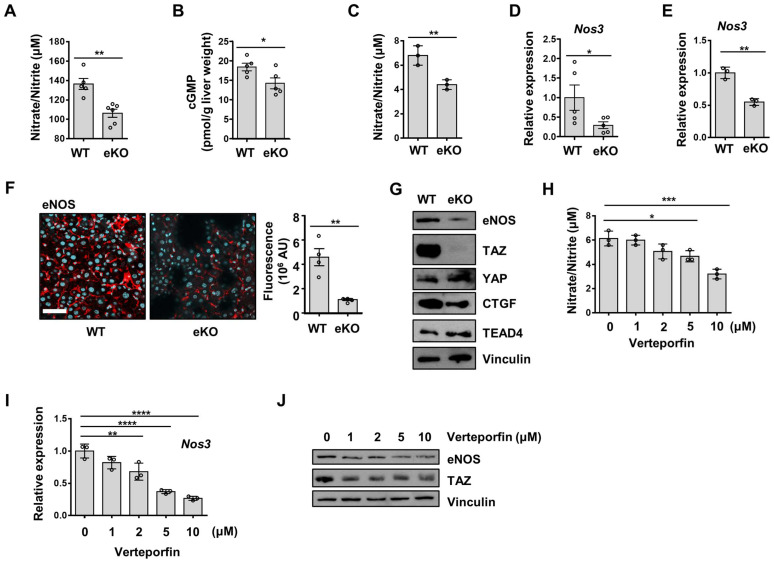
Figure 2.
Endothelial TAZ depletion decreases NO production. A) Serum was isolated from wild-type (WT) and endothelial-specific TAZ-knockout (eKO) mice, to quantify the nitric oxide (NO) levels. The NO levels were measured using an NO quantification assay kit (n = 5 for WT mice and n = 6 for eKO mice). B) Liver homogenates were prepared from WT and eKO mice. cGMP mass was normalized to the wet weight of the used liver (n = 5). C) WT and eKO liver sinusoidal endothelial cells (LSECs) were seeded on culture plates. The NO in the culture media was quantified at 24 h after seeding. D) Nos3 gene transcription was analyzed using quantitative real-time-polymerase chain reaction (qRT-PCR) in liver of WT and eKO mice (n = 5). E) Nos3 gene transcription in the WT and eKO LSECs was assessed using qRT-PCR. F) WT and eKO mice livers were immunostained with anti-eNOS antibodies (red). Nuclei were counterstained with 4′,6-diamidino-2-phenylindole (DAPI, blue). The presented data are representative images of multiple mice. The stained area was measured and calculated using ImageJ software (n = 4). Scale bar = 50 μm. G) Levels of indicated proteins in the WT and eKO LSECs were analyzed using immunoblotting. Vinculin was used as a loading control. H) LSECs were treated with verteporfin at the indicated concentration, for 24 h. The NO levels in the culture media were quantified using a NO quantification assay kit. I) The Nos3 transcription levels in panel H were analyzed using qRT-PCR. J) eNOS proteins in panel H were analyzed using immunoblot assay. The experiment was carried out in triplicate (C, E, H, and I). Eight to ten-week-old mice were used for all panels. Data are presented as mean ± SEM (A, B, D, and F) or mean ± SD (C, E, H, and I). (*P < 0.05, **P < 0.01, ***P < 0.0005, and **** P < 0.0001, A-C; as assessed using two-tailed Student's t-test, D-F; as assessed using one-tailed Student's t-test, H-I; as assessed using one-way ANOVA with Tukey's multiple-comparison test).

