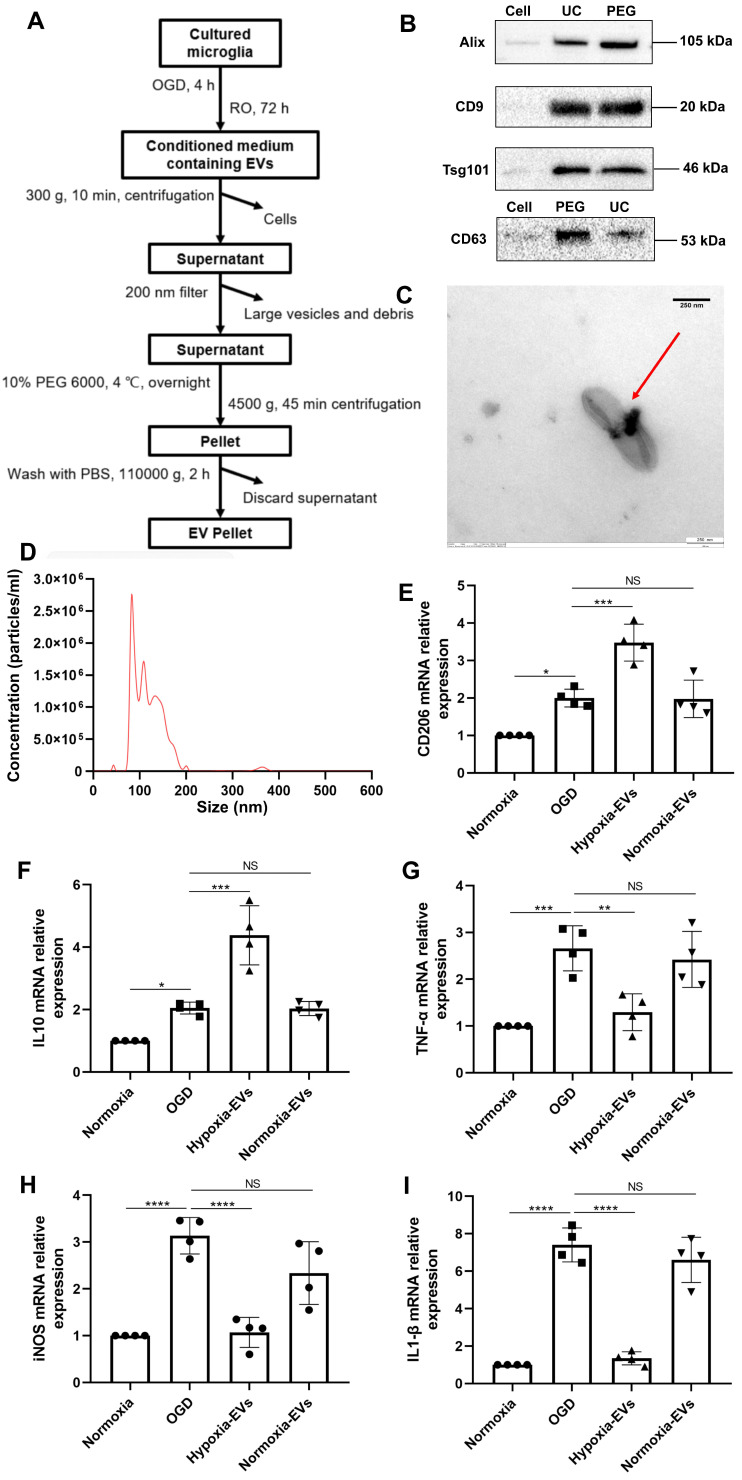
Figure 2.
Characterization of EVs from formerly hypoxic microglia and the impact of the increased concentration of such EVs on cortical microglia polarization upon induction of hypoxia. (A) In the schematic diagram, EVs were enriched from the conditioned medium of OGD-preconditioned microglia by the method of PEG precipitation combined with various centrifugation steps. (B) Western blot analysis of EVs against the exosomal representative markers such as Alix, CD9, Tsg101 and CD63. Western blots were conducted on total cell lysates and EV lysates (UC and PEG) from hypoxia-preconditioned microglia. (C) TEM analysis of vesicles derived from hypoxic microglia. (D) The size distribution patterns of EVs were assessed by NTA (n = 3). (E-F) RT-qPCR analysis assay of M2 microglia polarization marker IL-10 and CD206 mRNA in primary microglia in three groups: normoxia, 4 h of OGD followed by 24-h reoxygenation, and 4 h of OGD followed by 24-h reoxygenation with EV treatment (n = 4). (G-I) RT-qPCR assay of M1 microglia polarization marker TNF-α, iNOS, and IL-1β mRNA in primary microglia (n = 4). *p < 0.05; **p < 0.01; ***p < 0.001; ****p < 0.0001; NS, not statistically significant; RO, reoxygenation; TSG101, tumor susceptibility gene 101; IL, Interleukin; TNF-α, tumor necrosis factor-α; NTA, nanoparticle tracking analysis; PEG, polyethylene glycol; TEM, transmission electron microscopy; EVs, extracellular vesicles; iNOS, inducible nitric oxide synthase; UC, ultracentrifugation; OGD, oxygen-glucose deprivation; RT-qPCR, quantitative real-time PCR analysis.

