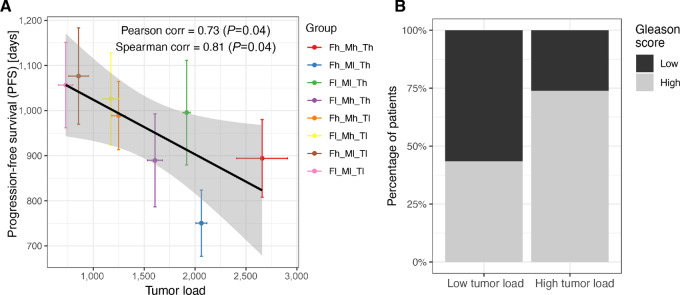
FIGURE 7.
Clinical validation of model predictions for different patient groups. A, Correlation between the simulated tumor growth (simulation time 400 days, 40 simulations per modeled patient group) and the average PFS time for clinical patients assigned to the matching patients groups based on molecular markers. Colors correspond to those used in Fig. 6B, portraying simulated tumor growth over time of the same classes. B, Binary Gleason scores per patient group; Gleason scores of 8 or higher were considered “high” and Gleason scores of 6 or lower were considered “low”.

