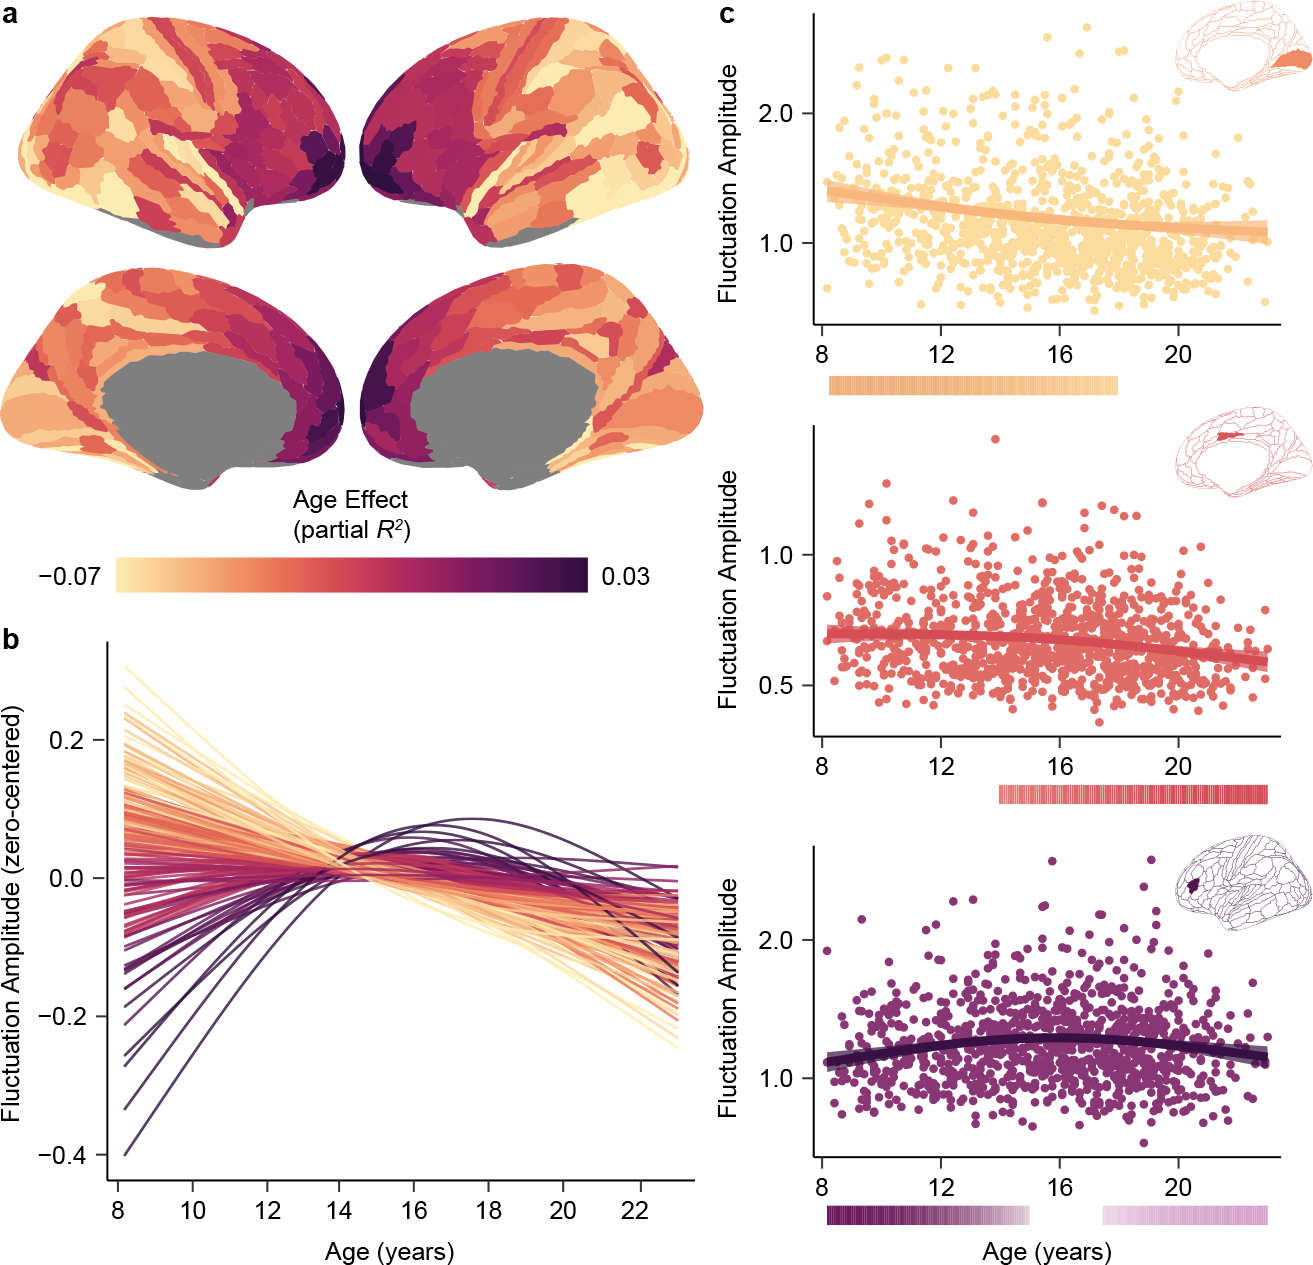
Fig. 1. Developmental refinement of fluctuation amplitude varies across the cortex.

a) The heterogeneous patterning of fluctuation amplitude age effects (partial R2) is displayed across the cortical surface. b) Fluctuation amplitude developmental trajectories (zero-centered GAM smooth functions) are shown for all left hemisphere cortical regions, revealing a spectrum of age-related change. Trajectories are colored by each region’s age effect using the color bar in panel a. c) Fluctuation amplitude developmental trajectories are shown overlaid on data from all participants for the primary visual cortex (area V1, yellow), the midcingulate gyrus (area p24pr, pink), and the dorsolateral prefrontal cortex (area IFSa, purple). Regional trajectories represent the GAM-predicted fluctuation amplitude value at each age with a 95% credible interval band. The color bars below each regional plot depict the age window(s) wherein fluctuation amplitude significantly changed in that region, shaded by the rate of change, as determined by the first derivative of the age function and the simultaneous 95% confidence interval around this derivative (two-sided).
