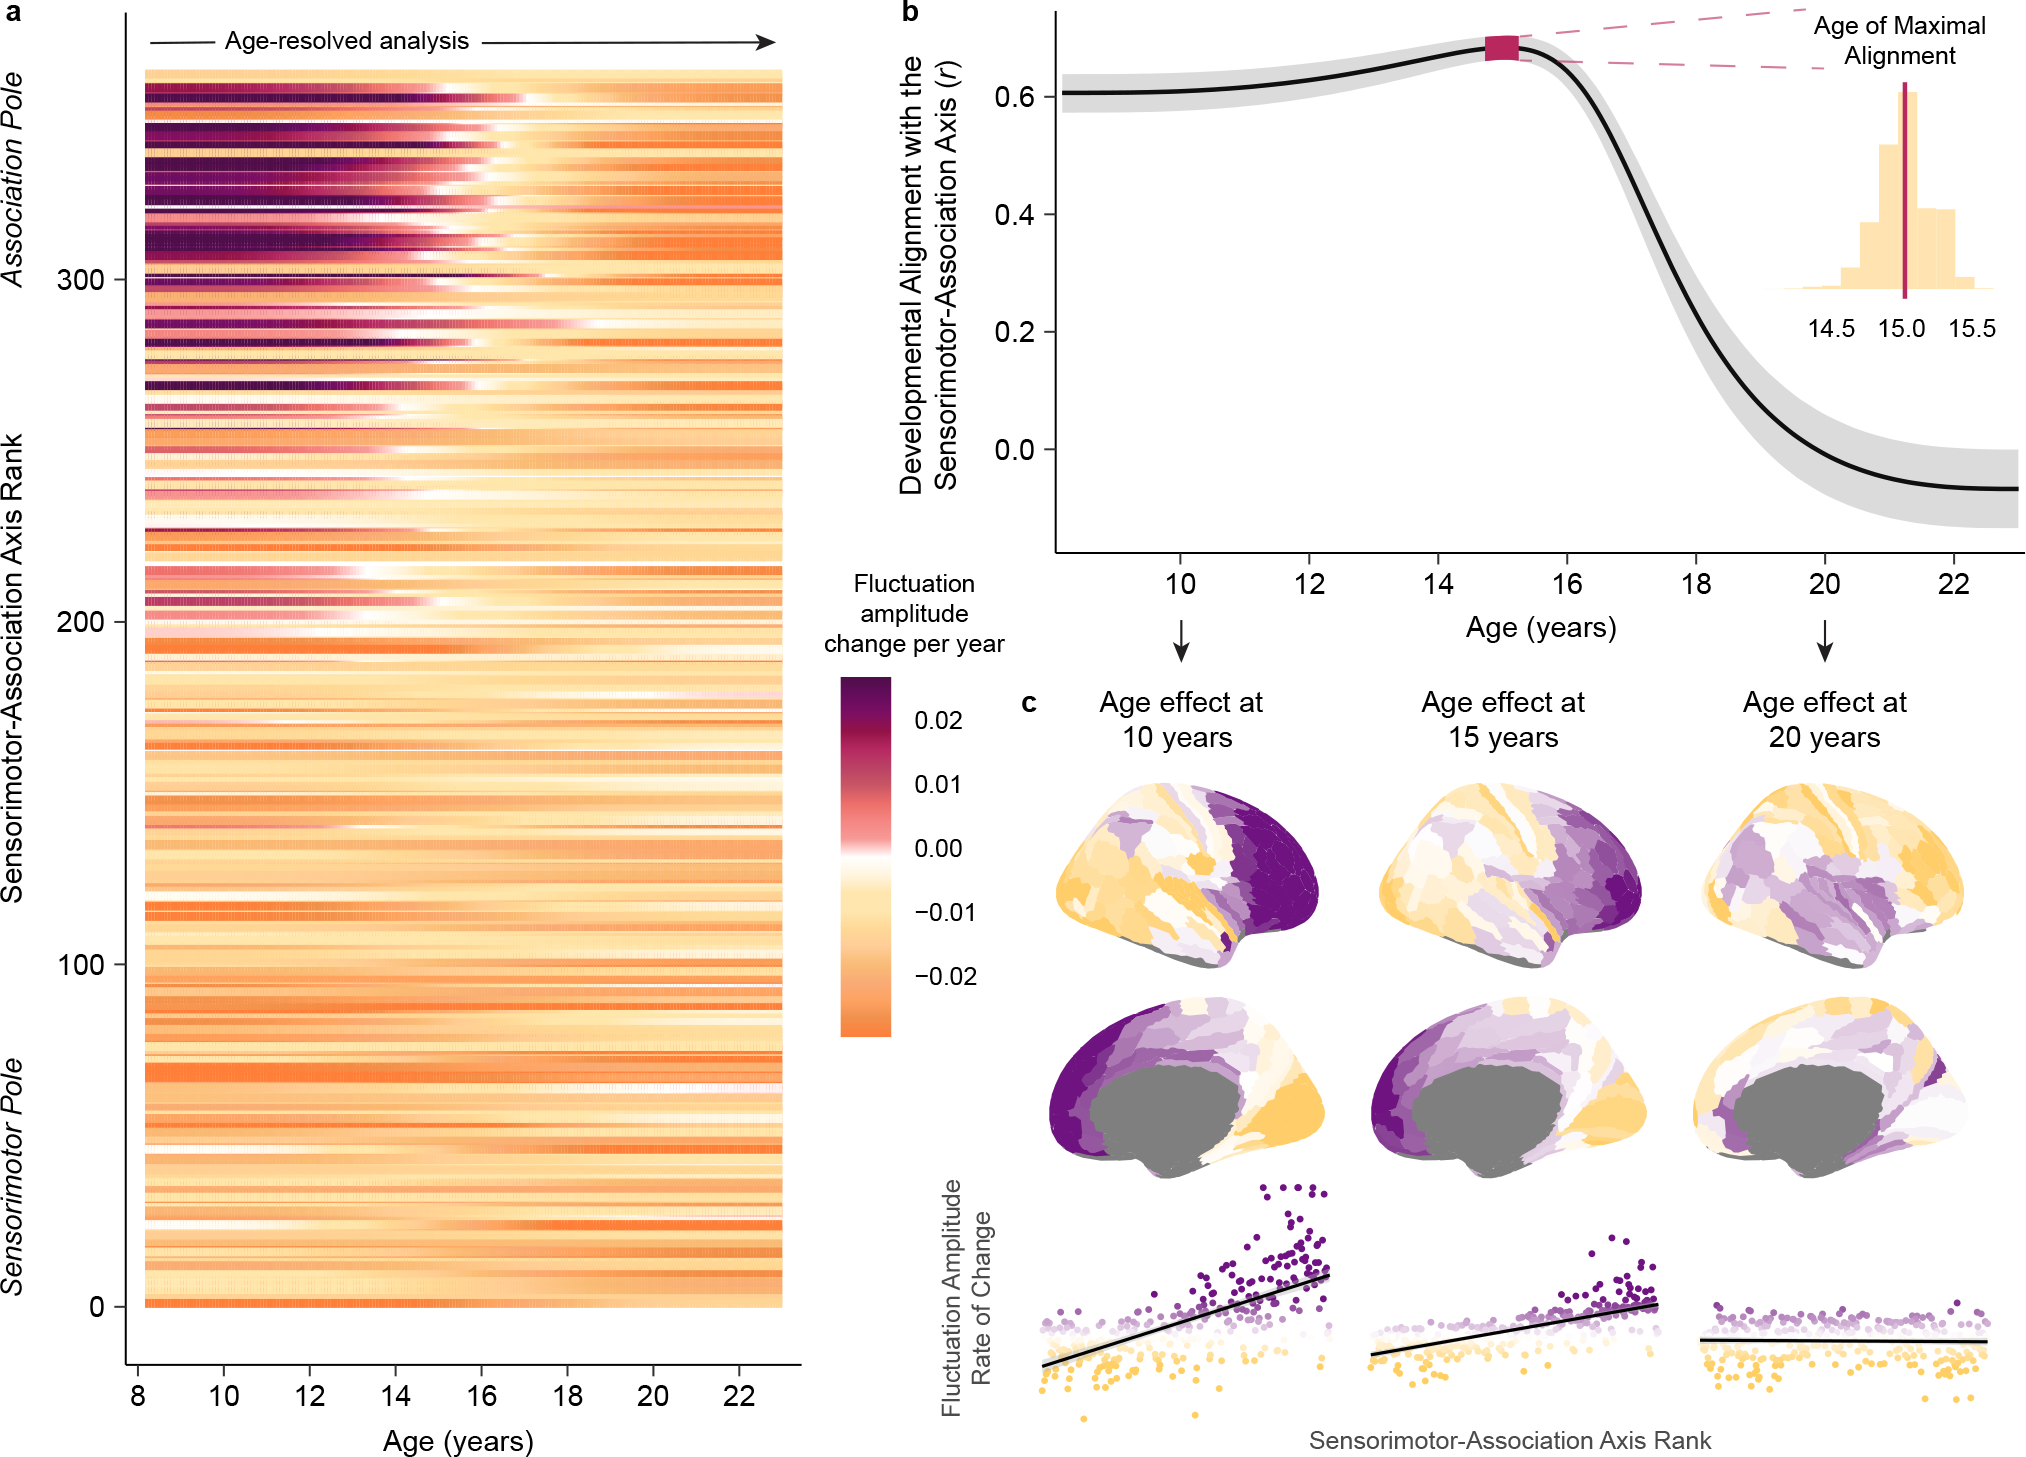
Fig. 4. Neurodevelopment unfolds along the sensorimotor-association axis until late adolescence.

a) The rate and direction of developmental change in fluctuation amplitude is displayed for each cortical region from ages 8 to 23 years. Regions are ordered along the y-axis by S-A axis rank. Fluctuation amplitude rate of change, expressed as the change in amplitude per year, was estimated from the first derivative of each region’s GAM smooth function for age. Cortical regions near the association pole of the S-A axis exhibit unique increases in fluctuation amplitude through childhood that culminate in adolescent BOLD amplitude peaks. b) Developmental change in intrinsic fMRI activity aligns with the S-A axis from childhood until late adolescence. The line plot displays age-specific correlation values (r) between regional rates of fluctuation amplitude change and regional S-A axis ranks from ages 8 to 23 years. To obtain reliable estimates of this correlation value at each age, we sampled 10,000 draws from the posterior derivative of each region’s age smooth function and quantified age-specific correlations between derivatives and S-A axis ranks for each draw. The median correlation value obtained across all draws is depicted by the black line and the 95% credible interval around this value is represented by the gray band. We additionally determined the age of maximal alignment between fluctuation amplitude change and S-A axis rank for all 10,000 draws. The 95% credible interval for the age of maximal alignment is depicted on the line plot by the pink band. The full distribution of ages obtained from all draws is portrayed in the inset histogram. c) Age-specific developmental effects (first derivative maps) are visualized on the cortical surface at age 10, 15, and 20 years. Maps are shown above scatterplots that depict the linear relationship (with a 95% confidence interval band) between regional S-A axis ranks and regional age-specific rates of fluctuation amplitude change. Scatterplot points are colored by age-specific rates of change. Developmental refinement of fluctuation amplitude is governed by the S-A axis at ages 10 and 15 years. By age 20, further refinement of fluctuation amplitude is unrelated to the S-A axis.
