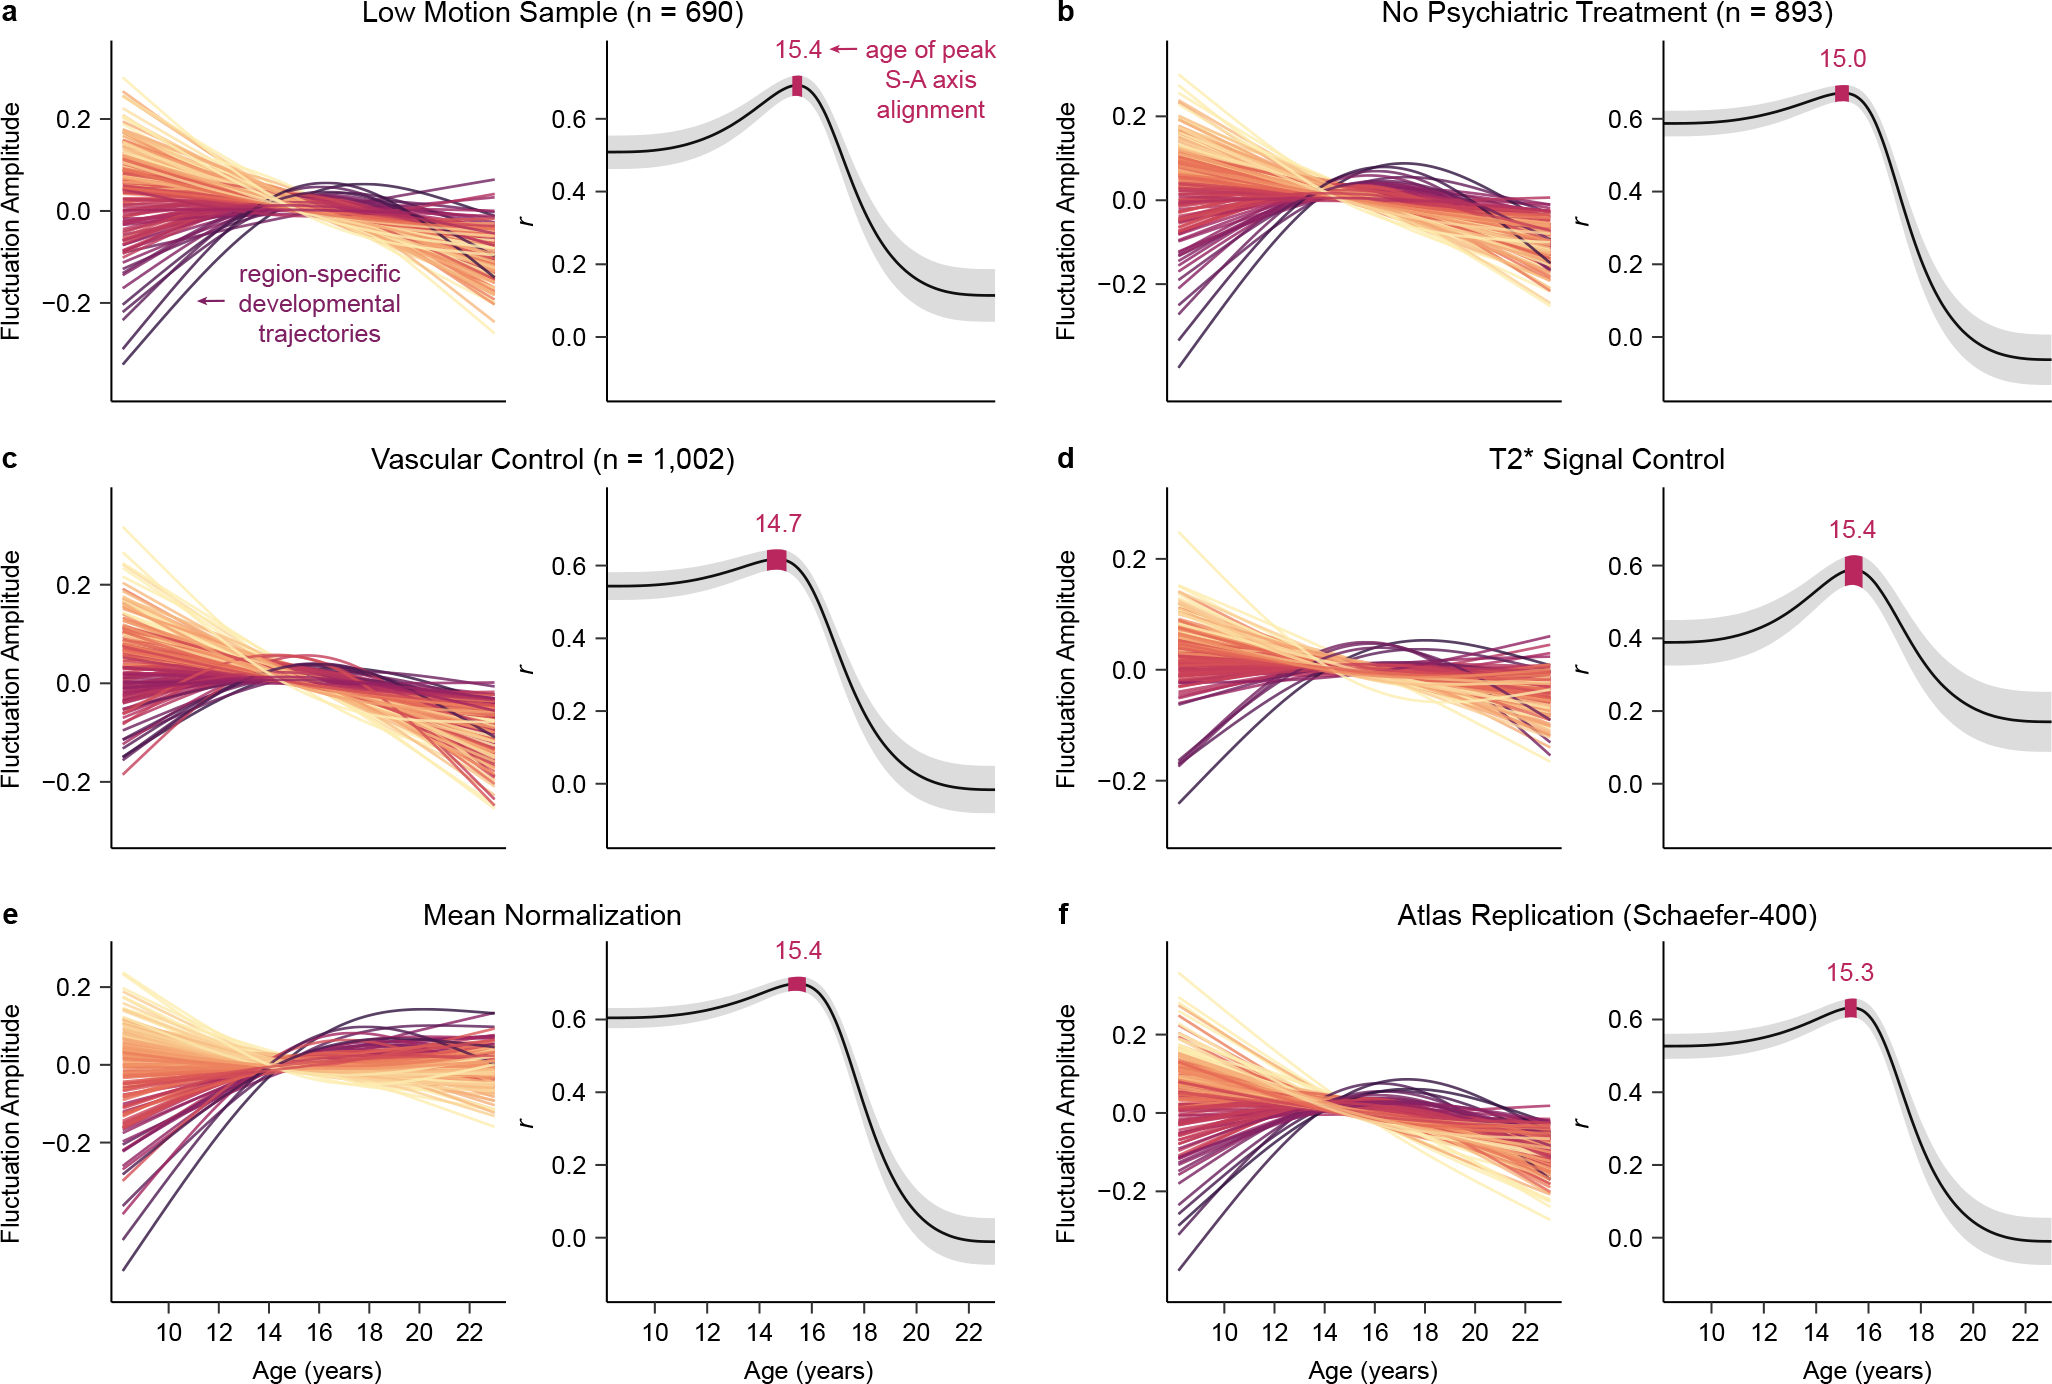
Fig. 5. Region-specific and cortex-wide developmental patterns are robust to methodological variation.

a-f) Key results are shown for each of the six sensitivity analyses performed. For each analysis, the left plot shows fluctuation amplitude developmental trajectories (zero-centered GAM smooth functions) for left hemisphere regions, colored by age effects. The right plot presents the age-resolved analysis of the correlation between developmental change in fluctuation amplitude and S-A axis rank from ages 8 to 23 years. Both the medial correlation value (r) and the 95% credible interval around this value are shown for the age-resolved analysis. All six sensitivity analyses yielded convergent region-specific and cortex-wide results, confirming that our developmental findings were not being driven by head motion in the scanner (a), the use of psychotropic medications (b), age-related changes in cerebrovascular perfusion (c), inter-scan differences in T2* signal strength (d), global effects (e), or the specific atlas used for cortical parcellation (f).
