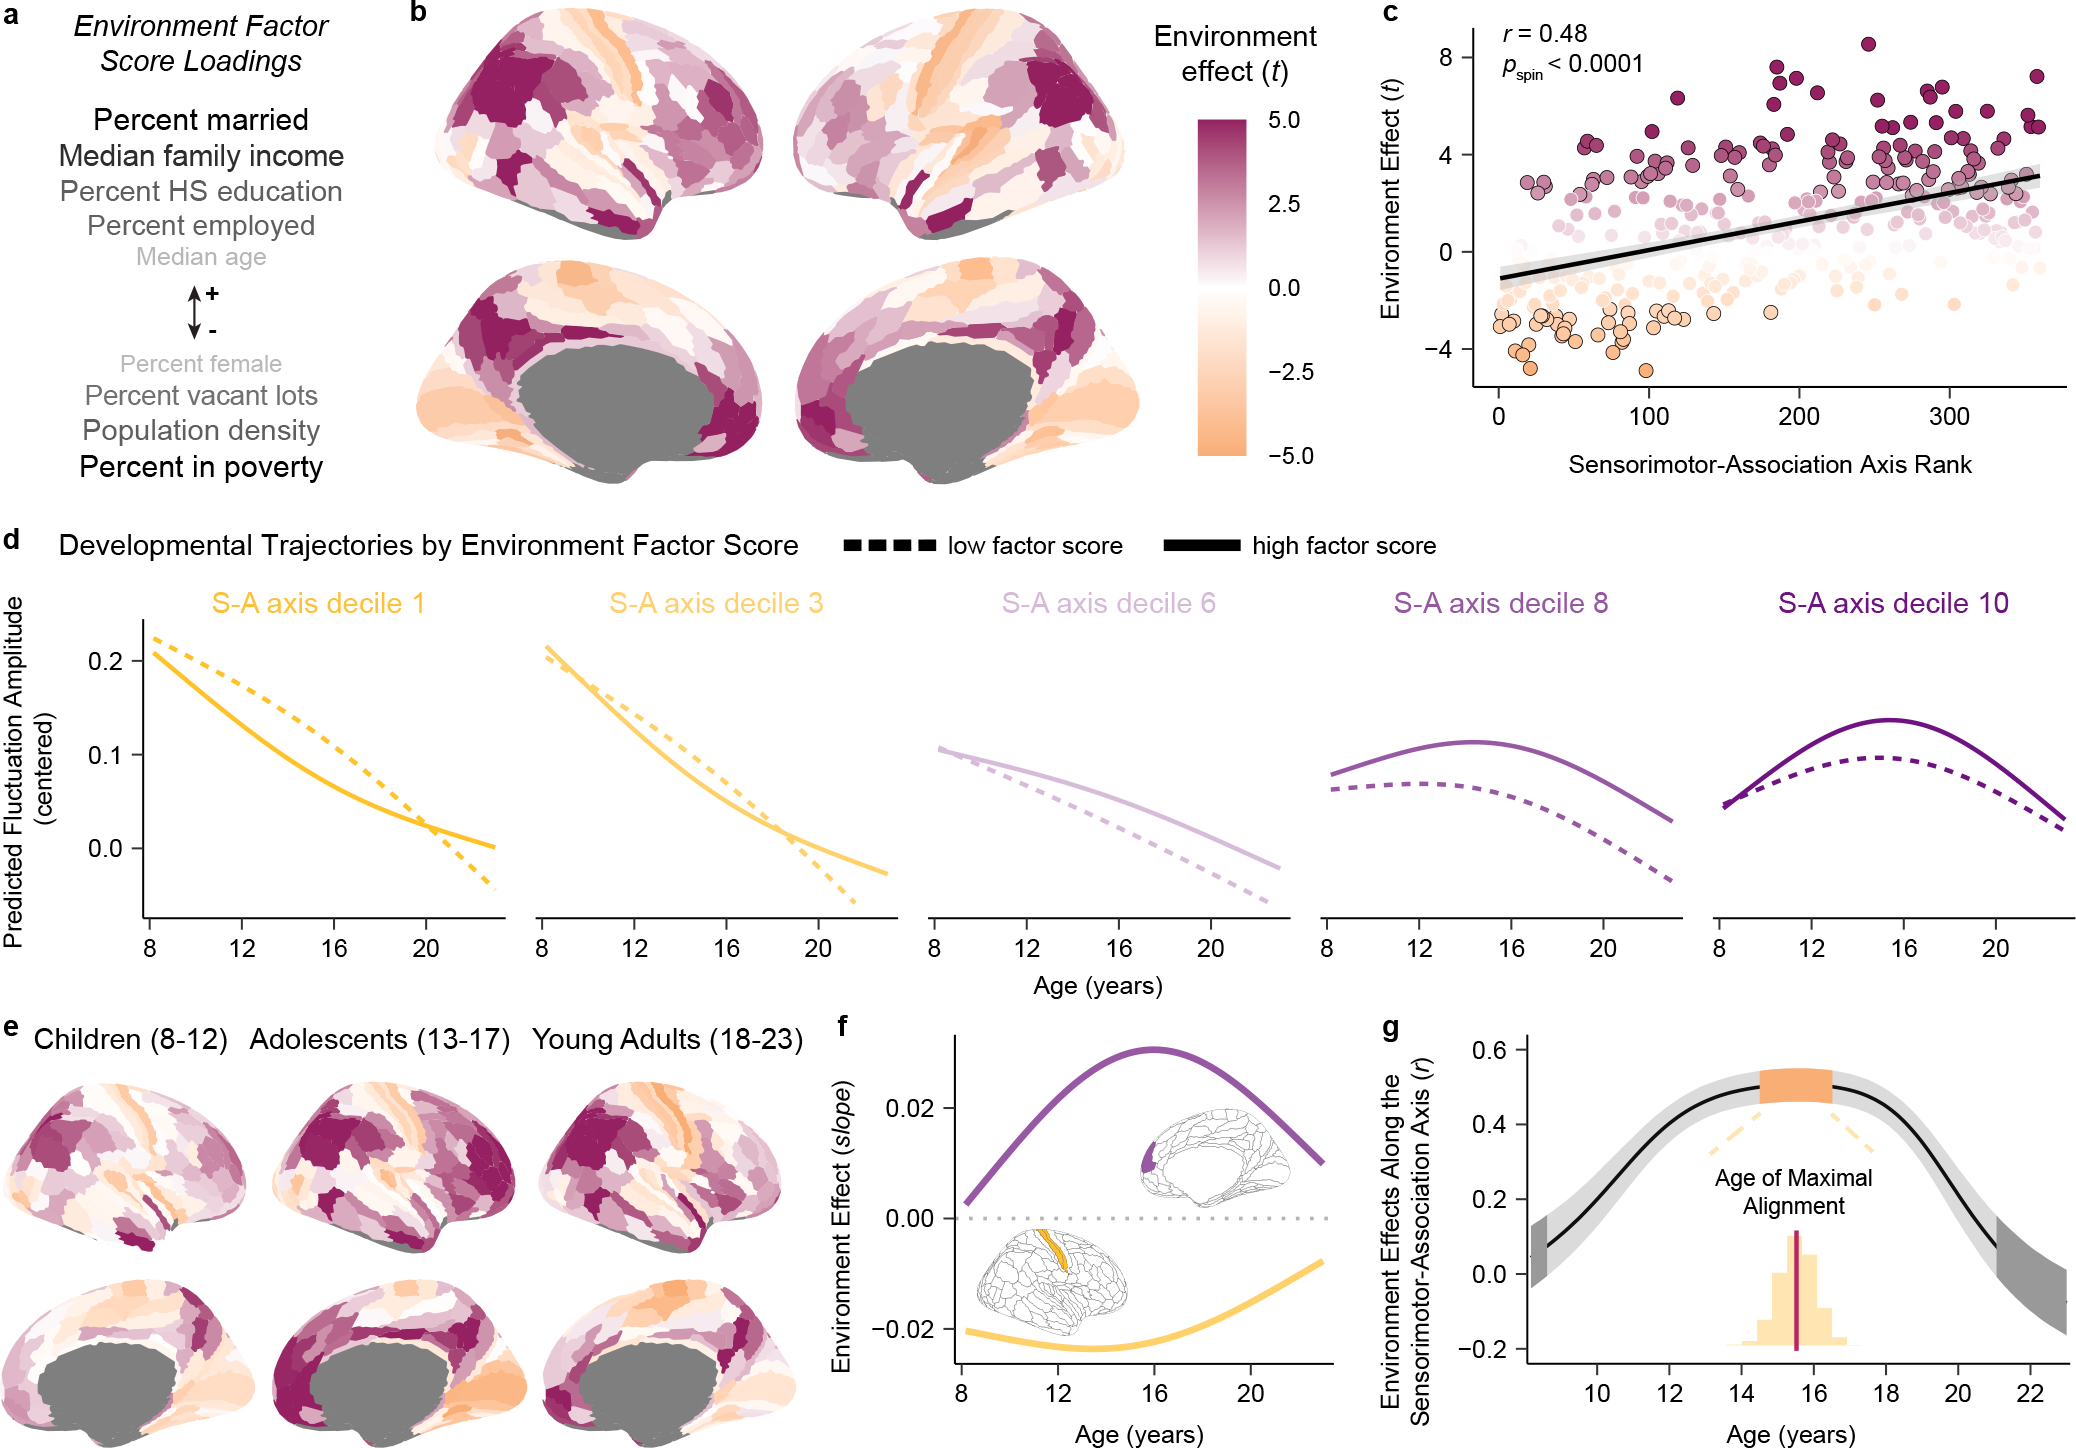
Fig. 6. Associations between fluctuation amplitude and the developmental environment vary along the sensorimotor-association axis in adolescence.

a) An environment factor score captures multiple features of each child’s neighborhood environment. Variables listed above (+) and below (−) the arrow positively and negatively loaded onto the factor score, respectively. Darker and larger text indicates stronger loadings. Higher factor scores reflect greater neighborhood-level socioeconomic advantage. b) A cortical map displaying regional associations (quantified by model t-values) between environment factor scores and fluctuation amplitude is displayed; the map partly recapitulates the S-A axis. c) Each region’s environment effect (t-value) is plotted against its S-A axis rank (linear fit shown with a 95% confidence interval). Regions with a significant environment effect following correction for multiple comparisons are outlined in black. The S-A axis explains significant variability in brain-environment associations (Spearman’s correlation with a spatial rotation-based significance test: r = 0.48, pspin < 0.0001). d) Fluctuation amplitude developmental trajectories are displayed for low and high environment factor scores for five deciles of the S-A axis, illustrating environment-associated differences in this measure by developmental timing. e) Cortical maps depicting region-wise associations between environment factor scores and fluctuation amplitude (as in b) in child, adolescent, and young adult groups show subtle differences in associations throughout development. Magenta and orange denote positive and negative environment effects (t-values), as in b. f) Age-specific environment effects are shown for an exemplar primary sensorimotor region (primary somatosensory cortex, area 3b, yellow) and transmodal association region (medial prefrontal cortex, area 9m, purple). The magnitude of effects is largest in adolescence in these regions. g) Regional differences in environment associations are most organized along the S-A axis in adolescence, as revealed by age-specific correlations between regional environment effects and S-A axis ranks. The plot depicts the median correlation value (r) at each age (black line) and the 95% credible interval around this value (gray band) obtained by sampling the posterior distribution of regional age-by-environment interaction GAMs 10,000 times. The orange and dark gray bands respectively designate credible intervals for the ages of maximal and zero correlation of environment effects with the S-A axis.
