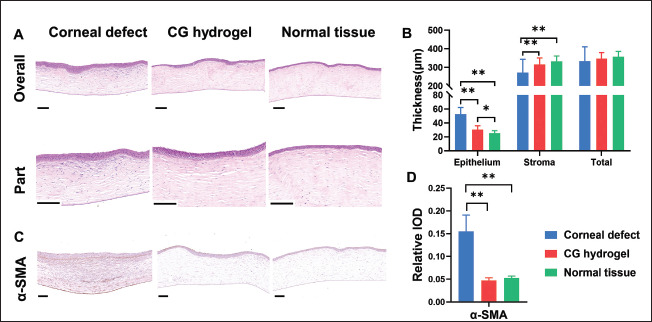
Figure 10.

(A) HE staining images of corneal defect, CG hydrogel-treated, and normal tissue at 8 weeks after surgery. (B) Quantitative results(epithelial, stroma, and total thickness) of repaired cornea (* p < 0.05, ** p < 0.01; experiment: CG hydrogel; control: corneal defect and normal tissue). The scale bar of overall is 200 μm; and the scale bar of part is 100 μm.(C) IHC staining images of corneal defect, CG hydrogel-treated, and normal tissue at 8 weeks after surgery (* p < 0.05, ** p < 0.01). (D) Quantification of IHC staining results (experiment: CG hydrogel; control: corneal defect and normal tissue). Scale bars = 100 μm.
