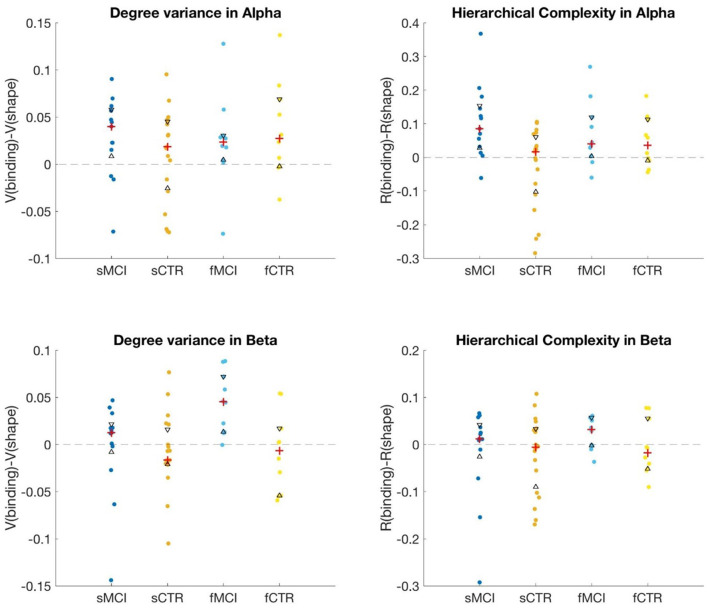
Figure 3.
Plots showing differences between binding and shape task PLI network hierarchies in Alpha and Beta1. Red crosses indicate median values while black triangles indicate 25th and 75th percentiles. MCI and CTR indicate mild cognitive impairment and controls, respectively, while the preceding “s” and “f” indicate the sporadic and familial data.

