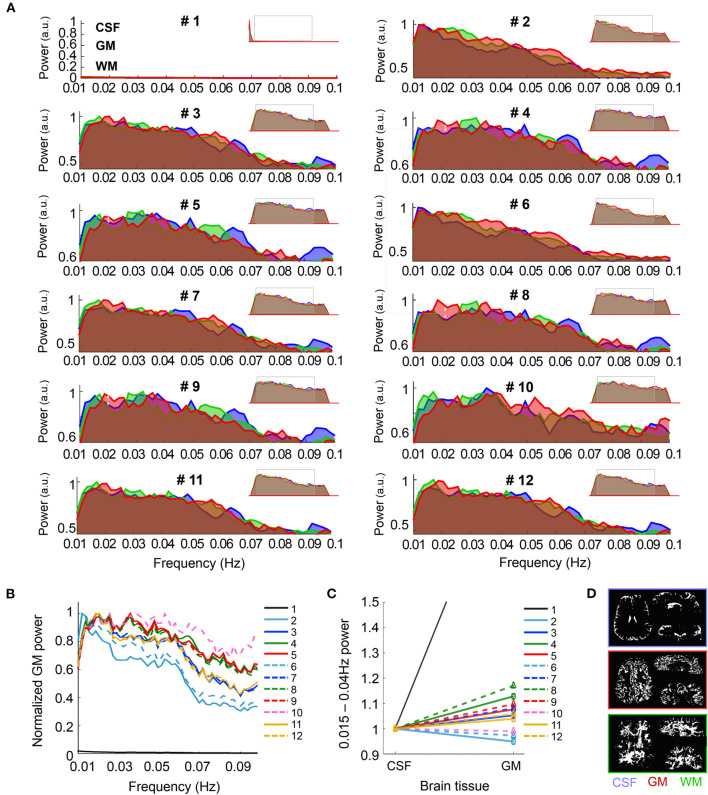
Figure 2.
Spectral characteristics of CSF, GM and WM upon different pre-processing. (A) The graphs show the frequency-power decomposition of the in CSF (blue), GM (red) and WM (green) that results from applying different pre-processing steps to the data. Minimized spectra in the upper right corner of each graph represent the full spectrum (0.001–0.14 Hz). (B) The graph shows the normalized power of the fMRI signal in the GM after the twelve different pre-processing approaches. Note that the normalized signal in Pre-proc. #1 (black line) is near zero due to its maximum value being below 0.01 Hz. (C) Average power of the frequency range 0.015–0.04 Hz with respect to the whole spectrum for CSF and GM, normalized to the CSF value, upon different pre-processing. Note the higher GM/CSF ratio obtained after adding phase-regression (dashed lines vs. solid lines, for each color). (D) Example of the tissue-specific masks generated automatically from the mean functional image in one volunteer. N = 13 healthy volunteers [for (A–C)].

