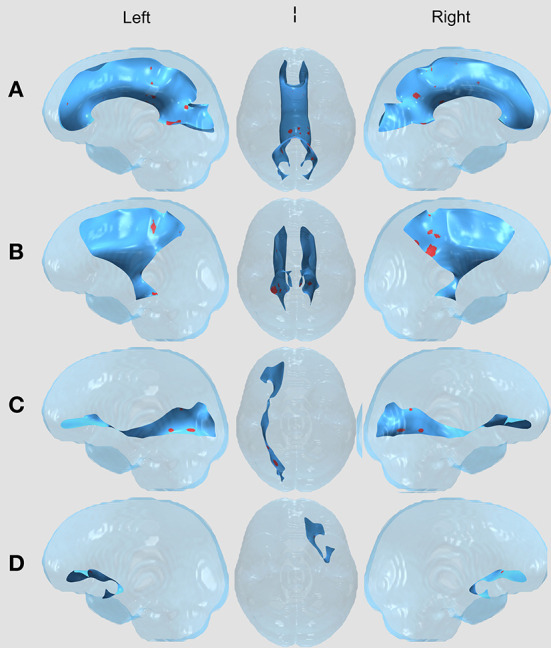
Figure 2.

WM Tract Results in the Surgery and Chemotherapy vs. Healthy Controls comparison. All results displayed on a transparent glass brain. The background tract is in blue while the clusters after multiple comparisons correction are displayed in red. The three columns, left to right, display results in a leftward facing sagittal view, inferior facing axial view, and rightward facing sagittal view in the (A) Corpus callosum (CC); (B) Bilateral corticospinal tract (CST); (C) Right inferior frontal occipital fasciculus (right IFOF); and (D) left uncinate fasciculus (left UF).
