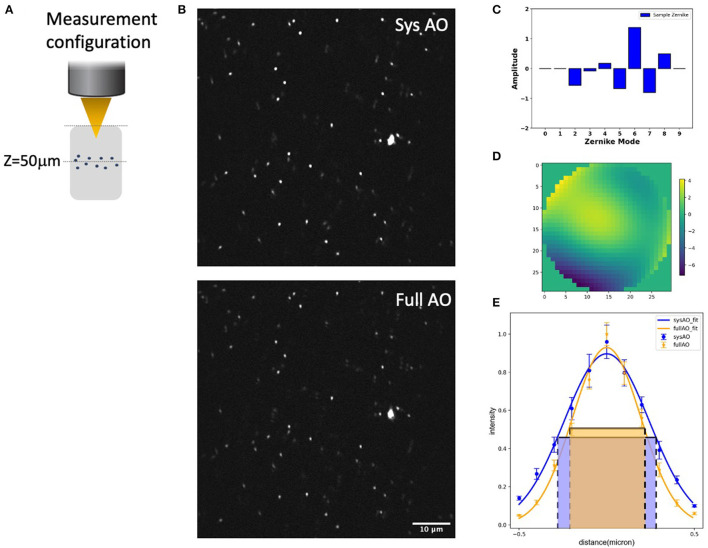
Figure 4.
System and mean-intensity-based full AO on 0.2 μm beads (B) at 50 μm depth in an agarose gel (A). Zernike mode decomposition of the wavefront (C). Wavefront after full AO (μm) (D). Spot size (E). The red and green boxes represent the FWHM of each intensity profile. The FOV is 67.5 × 67.5 μm. Data are represented as mean +/– standard deviation for each measurement. Scale bar = 10 μm.

