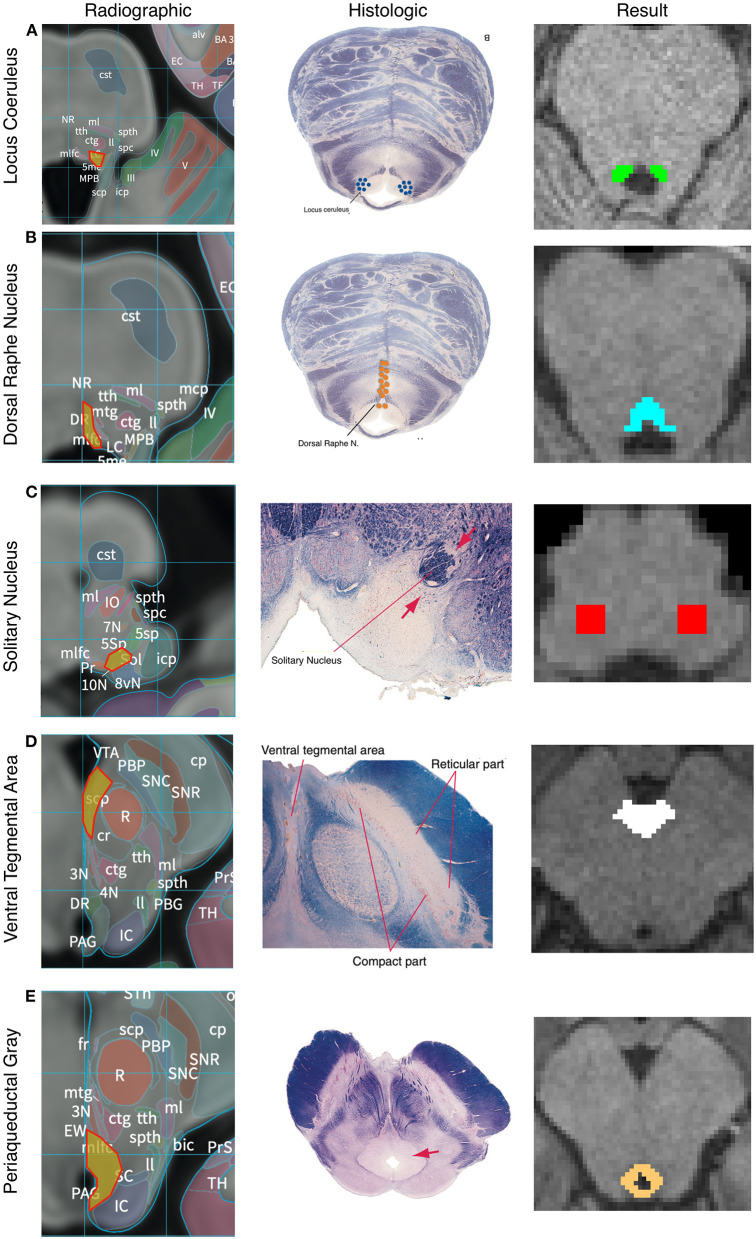
Figure 2.
Anatomic boundaries. Diagram of how anatomic boundaries of nuclei were masked. First radiographic23 (left pane) and histologic atlas24 (middle pane) were carefully examined for each nucleus. Using a combination of anatomic landmarks and voxel measurements (not shown), the resulting mask (right pane) was created in FSL. Locus Coreleus (A), Dorsal Raphe Nucleus (B), Solitary nucleus (C), Ventral tenemental area (D), Periaquaductal Grey (E).

