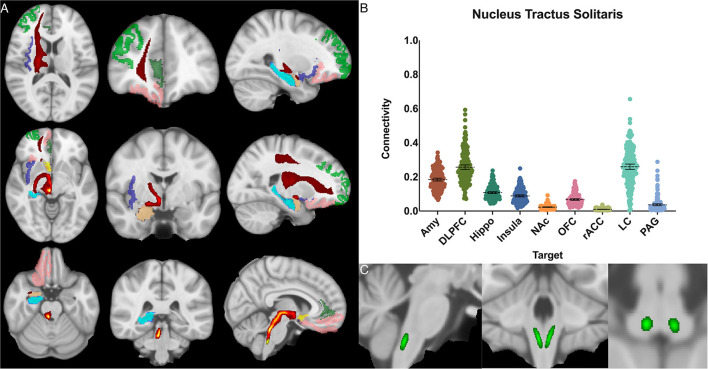
Figure 5.
Nucleus tractus solitarius structural results. (A) MNI space structural connectivity results visual representation averaged over all 197 subjects. Brighter yellow on heat map indicates a high number of samples passing through a given point that will eventually reach a target map (brighter yellow = more samples). Dark green: DLPFC; pink: OFC; brown: AMY; blue: HIPPO; purple: insula; orange: NAc; light green: rACC. (B) Mean connectivity results with dashed line showing mean and 95% CI, each point on graph shows result from individual subject. (C) Anatomic MNI mask of seed region.

