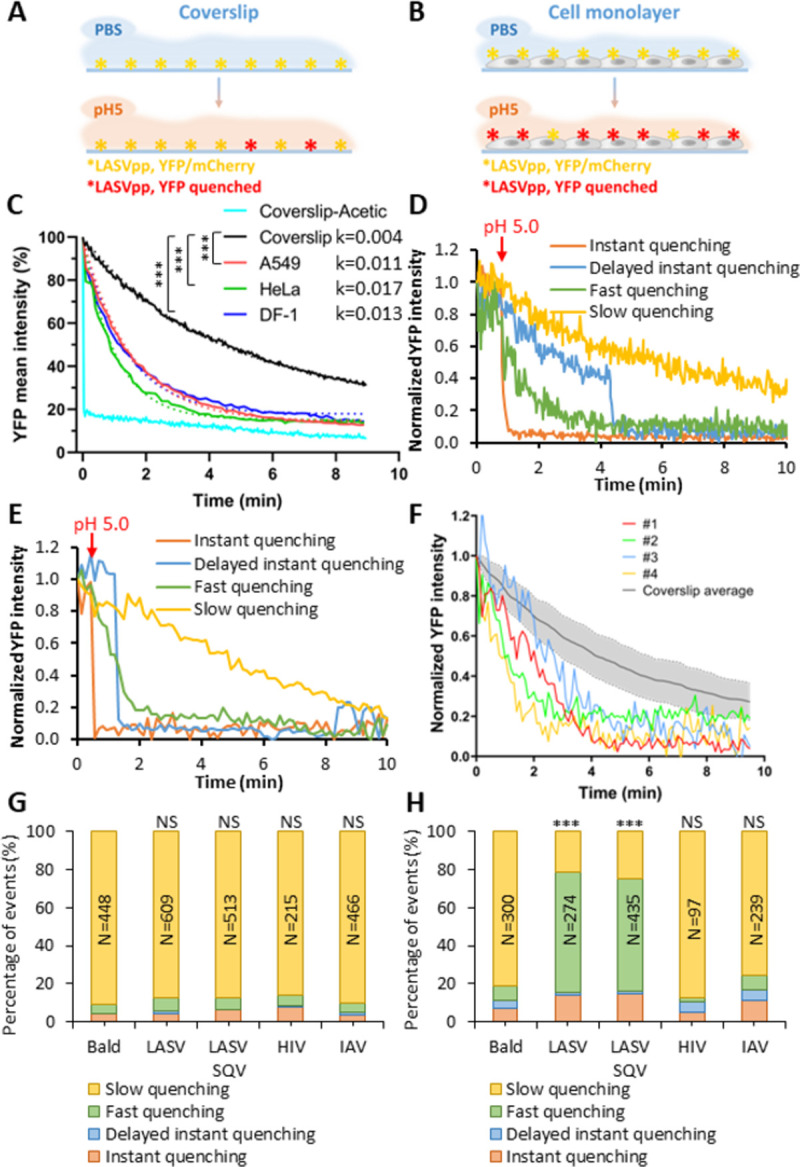
Fig 4. Virus-cell contact promotes LASVpp membrane permeabilization at low pH.

(A, B) Illustration of the effects of LASVpp exposure to low pH on a coverslip (A) and on the cell surface (B). LASVpp were bound to the cell surface or to poly-L-lysine coated coverslips at 4°C. GPc conformational changes are triggered by applying membrane impermeable pH 5.0 citrate buffer. (C) Mean YFP intensity decay of all coverslip-attached particles in the image field or on cells. Dotted-lines are single- exponential decay fits of data shown by solid lines. Control YFP quenching profile upon application of a membrane-permeable pH 5.0 acetic buffer is shown. Exponential decay rates k are in 1/sec. Results were analyzed by Student’s t test, ***, p<0.001; NS, p>0.05. (D, E) Representative examples of four types of YFP quenching of single LASVpp on coverslip (D) or on cells (E). The point of adding a low pH buffer is marked with the red arrows. (F) Examples of the fast single virus YFP quenching events in A549 cell surface (#1-#4) overlaid onto the average YFP intensity profile for single LASVpp acidified on coverslip. The shaded area represents standard deviation of the mean YFP decay curve. (G, H) Quantification of the above four categories of YFP-Vpr quenching of single LASVpp on coverslip (G) or on DF-1 cells (H). Numbers within the bars are the total numbers of particles analyzed by Fisher’s exact test. ***, p<0.001; NS, not significant.
