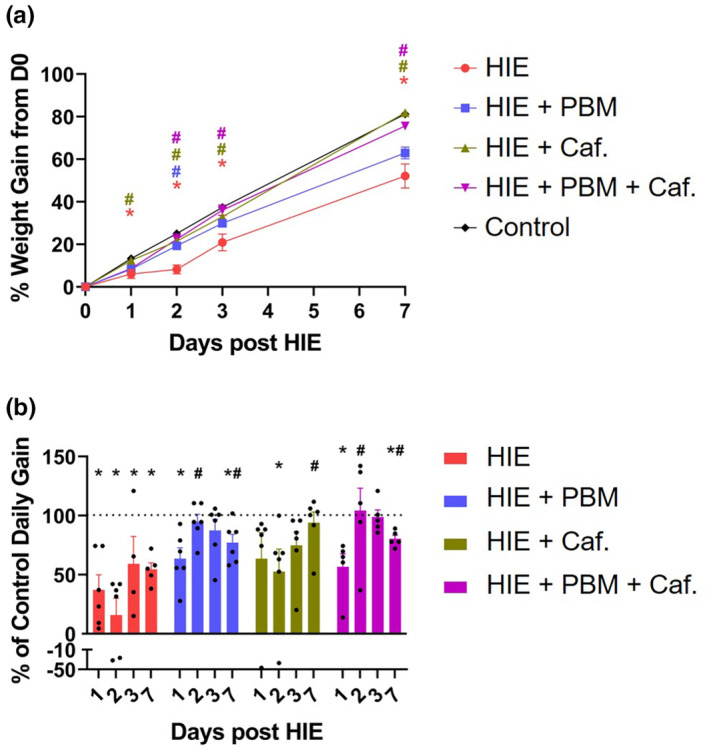
FIGURE 5.

Percent body weight gain above D0 body weight (a) and daily weight gain as percentage of weight gain of control pups (b) of pups receiving HIE injury and either no treatment or treatment with PBM or caffeine, alone and in combination, at 1, 2, 3, and 7 days from start of experiment. Negative values indicate weight loss. Symbols and bars represent mean ± SD of n = 4–6 pups/group. Data points represent individual animals. *Significantly different (p < 0.05) from time point and treatment matched controls not receiving HIE. #Significantly different (p < 0.05) from time point matched HIE pups not receiving treatment.
