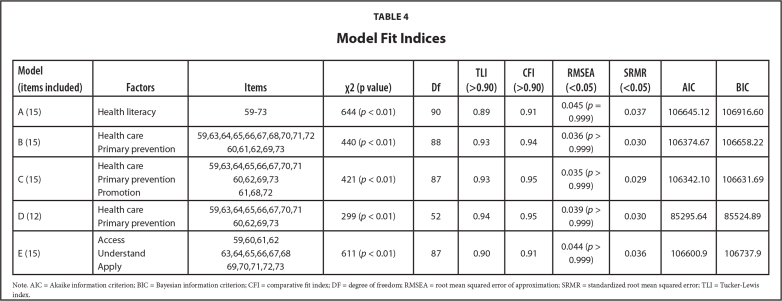
Table 4.
Model Fit Indices
| Model (items included) | Factors | Items | χ2 (p value) | Df | TLI (>0.90) | CFI (>0.90) | RMSEA (<0.05) | SRMR (<0.05) | AIC | BIC |
|---|---|---|---|---|---|---|---|---|---|---|
|
| ||||||||||
| A (15) | Health literacy | 59–73 | 644 (p < 0.01) | 90 | 0.89 | 0.91 | 0.045 (p = 0.999) | 0.037 | 106645.12 | 106916.60 |
|
| ||||||||||
| B (15) | Health care | 59,63,64,65,66,67,68,70,71,72 | 440 (p < 0.01) | 88 | 0.93 | 0.94 | 0.036 (p > 0.999) | 0.030 | 106374.67 | 106658.22 |
| Primary prevention | 60,61,62,69,73 | |||||||||
|
| ||||||||||
| C (15) | Health care | 59,63,64,65,66,67,70,71 | 421 (p < 0.01) | 87 | 0.93 | 0.95 | 0.035 (p > 0.999) | 0.029 | 106342.10 | 106631.69 |
| Primary prevention | 60,62,69,73 | |||||||||
| Promotion | 61,68,72 | |||||||||
|
| ||||||||||
| D (12) | Health care | 59,63,64,65,66,67,70,71 | 299 (p < 0.01) | 52 | 0.94 | 0.95 | 0.039 (p > 0.999) | 0.030 | 85295.64 | 85524.89 |
| Primary prevention | 60,62,69,73 | |||||||||
|
| ||||||||||
| E (15) | Access | 59,60,61,62 | 611 (p < 0.01) | 87 | 0.90 | 0.91 | 0.044 (p > 0.999) | 0.036 | 106600.9 | 106737.9 |
| Understand | 63,64,65,66,67,68 | |||||||||
| Apply | 69,70,71,72,73 | |||||||||
Note. AIC = Akaike information criterion; BIC = Bayesian information criterion; CFI = comparative fit index; DF = degree of freedom; RMSEA = root mean squared error of approximation; SRMR = standardized root mean squared error; TLI = Tucker-Lewis index.

