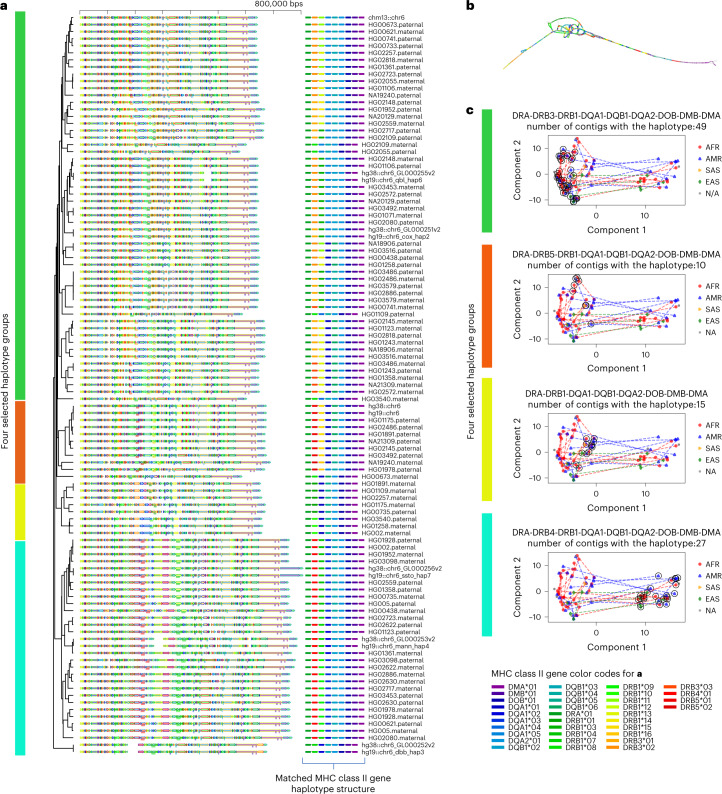
Fig. 3. Principal bundle decomposition reveals distinct haplotype groups.
a, The principal bundle decomposition and annotated HLA class II genes in each of the haplotype sequences. The auxiliary tracks below each sequence on the left panel show the locations of the genes. The colors of the auxiliary tracks match the gene list of genes identified for each haplotype on the right. b, The MAP-graph generated by PGR-TK. c, PCA plots of the MHC class II sequences. Each panel highlights the different gene haplotype combinations. The vertical color bars indicate the matched haplotype groups in b and c. The circled symbols indicate the haplotypes belong to the corresponding group. The dotted lines represent the connection between the two haplotypes of individuals included in the analysis set who possess both haplotypes. The population groups, African Ancestry(AFR), American Ancestry (AMR), South Asia Ancestry(SAS), East Asia Ancestry(EAS) and not applicable (NA), are indicated with different markers of different colors.

