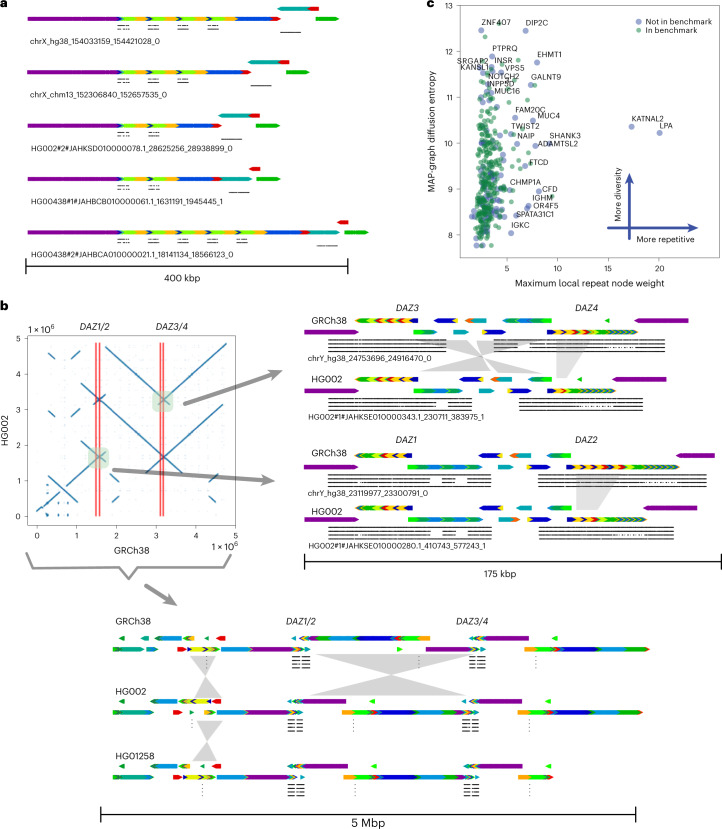
Fig. 4. Principal bundle decomposition for genes in the repetitive regions of chromosome X and Y.
a, MAP-graph principal bundle decomposition shows the repeat number changes of the OPN1LW, OPN1MW1/2/3 to FLNA loci. Auxiliary tracks are as follows: top OPN1LW, middle OPN1MW1/2/3 and bottom FLNA. b, The upper left image displays a dot plot comparing the HG002 assembly to GRCh38 over a 5 Mb region containing the DAZ1/2/3/4 loci, highlighting an inversion between DAZ1/2 and DAZ3/4. The image on the right provides a detailed view of the rearrangements at the gene scale level, with four tracks indicating the local matches to DAZ1/2/3/4 from top to bottom. Comparison to GRCh38’s DAZ2 reveals that the HG002 assembly is missing a segment (roughly 10 kb) of the darker green. The intergenic region between DAZ3 and DAZ4 also displays a rearrangement that can be described as an incomplete inversion or separate insertions and deletions. The bottom image shows a rearrangement at the whole locus, including all DAZ1/2/3/4 over a 5 Mb region. The principal bundle decomposition reveals the different inverted structure of the HG002 T2T assembly and the HG1258 assembly compared to GRCh38. c, MAP-graph diffusion entropy versus repetitiveness survey for the 385 GIAB challenge CMRGs.

