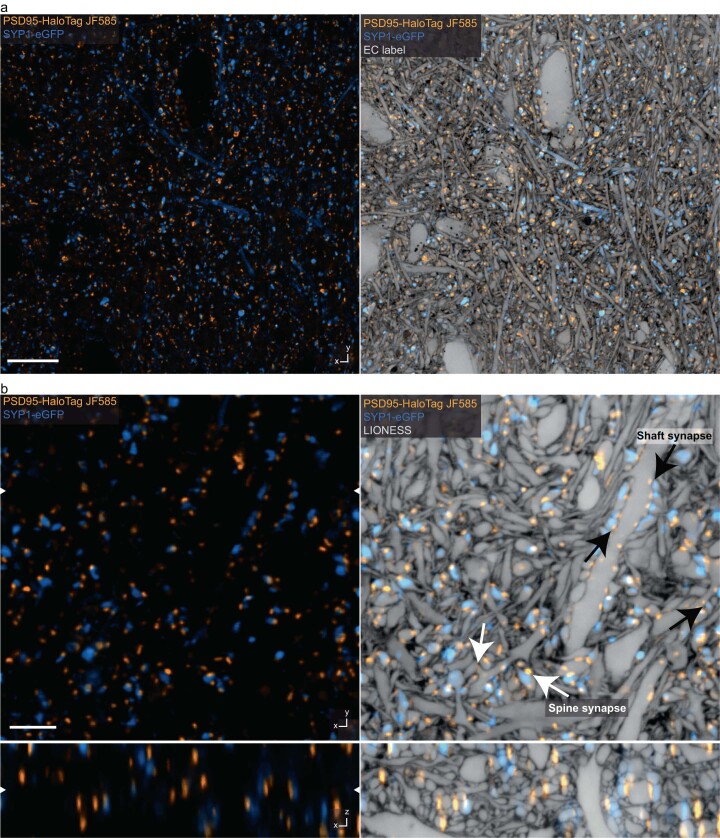
Extended Data Fig. 5. Structural and molecular information.
a, Overview image of CA1 hippocampal neuropil in living organotypic slice culture from a transgenic mouse line expressing post-synaptic density protein 95 (PSD95)-HaloTag to label excitatory postsynapses (orange, STED, single plane, power distribution z-STED vs. xy-STED patterns: 80/20). A subset of presynaptic terminals were labeled with a synaptophysin 1 (SYP1)-eGFP fusion protein, encoded by a pseudotyped rabies virus (blue, confocal). Left: Molecular markers. HaloTag labeled with JF585. Right: Same region with structural context from additional extracellular labeling (STED, single plane, power distribution z-STED vs. xy-STED patterns: 80/20). Scale bar: 10 µm. b, Orthogonal planes in xy- and xz-direction of an imaging volume in CA1 from a different organotypic hippocampal slice sample. Labeling and color coding as in panel a. Left: Confocal imaging after denoising with Noise2Void. Right: Additional overlay with isotropically super-resolved LIONESS data, clarifying the relationship of molecularly defined entities (pre- and postsynapses) with cell- and tissue-structure. Diffraction-limited (confocal) synaptic molecule signals extend beyond corresponding structures recorded in LIONESS mode, particularly evident in the xz-view. White arrows indicate excitatory spine synapses, black arrows indicate excitatory shaft synapses. White arrowheads at image edges indicate the position of corresponding orthogonal planes (left image). The images are representative of n = 4 independent experiments. LIONESS images correspond to maximum intensity projections spanning 150 nm. Scale bar: 3 µm.

