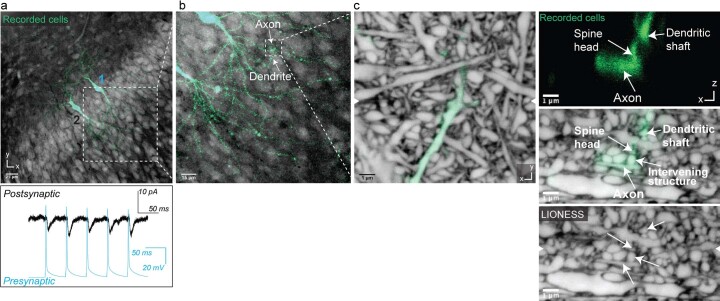
Extended Data Fig. 9. Correlating structural with electrophysiological information.
a, Two CA1 pyramidal neurons after patch-clamp recording and filling with fluorescent dye in living organotypic hippocampal slice culture. Excitatory postsynaptic currents in neuron 2 (black trace in bottom panel, recorded in voltage-clamp configuration), elicited by action potentials in neuron 1 with short latency (<4 ms) (blue trace in bottom panel, triggered by current injection pulses in current-clamp configuration). Scale bar: 25 µm. Confocal image of positively labeled neurons (green) and extracellular label (gray) with low-numerical aperture objective. b, Region where axon of neuron 1 overlaps with a dendrite of neuron 2. Scale bar: 15 µm. c, Detailed view of overlap region with positively labeled structures (green) read out in confocal mode with a high-numerical aperture objective, embedded in the surrounding volume recorded with isotropically super-resolved LIONESS. Orthogonal views in xy- and xz-directions, with arrowheads at image edges indicating the position of the corresponding orthogonal sections. The images are representative of n = 3 experiments in different biological samples. Scale bars: 1 µm. Maximum intensity projections spanning 150 nm.

