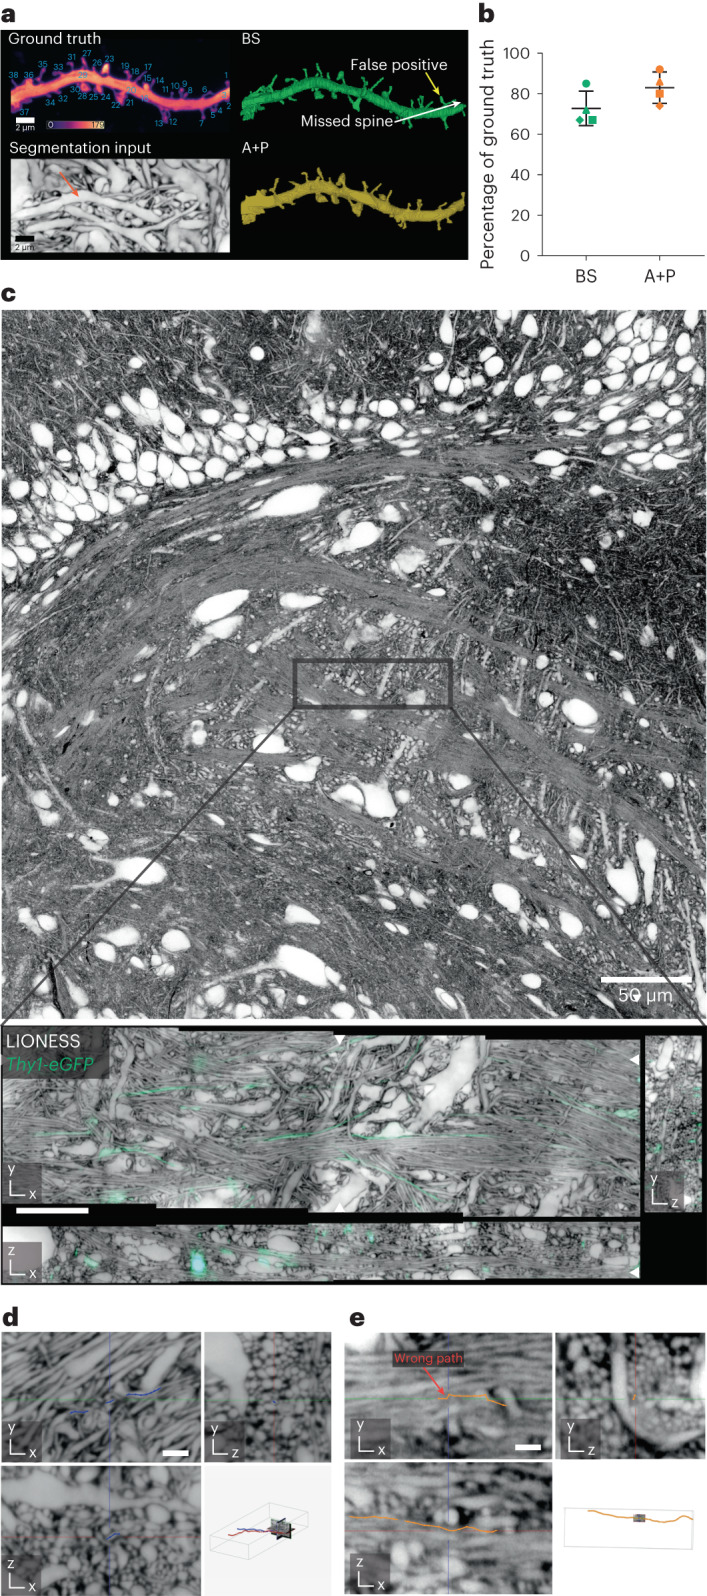
Fig. 2. Validation of segmentation.

a, Maximum intensity projection of a dendrite in organotypic hippocampal slice culture labeled by cytosolic eGFP expression (Thy1-eGFP mouse line, confocal) (top left). The positive label served as ground truth for spine detection, with individual spines numbered. Calibration bar represents raw photon counts. Plane from isotropically super-resolved, volumetric LIONESS acquisition used as source data for segmentation with arrow indicating the same dendrite in the extracellularly labeled tissue (maximum intensity projection spanning 150 nm) (bottom left). Fully manual spine detection from LIONESS imaging data by a segmenter blinded to the eGFP channel (BS, blinded segmenter) (top right). Examples of missed and false-positive spines are indicated by white and yellow arrows, respectively. Spine detection in 3D reconstruction after automated segmentation and proofreading of LIONESS imaging data by the experimenter who recorded the data (automated plus proofreading, A + P) (bottom right). As this person was not blinded to the eGFP channel, this indicates which spines can be retrieved from LIONESS but does not serve as an independent control. b, Percentage of correctly assigned spines from the automated plus proofread (A + P, orange) and manual (BS, green) segmentations relative to the total number of spines in the positively labeled ground truth with mean and s.d. for n = 4 different dendrite stretches originating from three different organotypic hippocampal slices (images for remaining datasets are shown in Supplementary Fig. 8). Correctly identified spines were counted as +1, false positives as −1. In two cases out of 129 the manual tracer identified the spine but omitted the spine head. These were counted as +0.5. c, Confocal overview in organotypic hippocampal slice with a band of DG cells in the top part and the start of CA3c in the center (top). Orthogonal planes from LIONESS volume at the position indicated in the top panel, including sparse eGFP expressing axons (Thy1-eGFP, confocal) used as ground truth for tracing (bottom). White arrowheads at image edges indicate position of corresponding orthogonal planes. Scale bar, 10 µm. LIONESS images are maximum intensity projections spanning 150 nm. d, Magnified view of three orthogonal planes from a LIONESS imaging volume in an organotypic hippocampal brain slice with example of a correctly traced axon (blue line with dots, manually generated in WebKnossos by a tracer blinded to the eGFP channel). Scale bar, 1 µm. Position of subvolume relative to full imaging volume with two traced axons in red and blue (bottom right). e, Example of an error in tracing (orange line with dots), marked with red arrow. The images in c–e are representative for tracing a total of nine axons in n = 3 different cultured brain slices from Thy1-eGFP mice. Scale bar, 1 µm.
