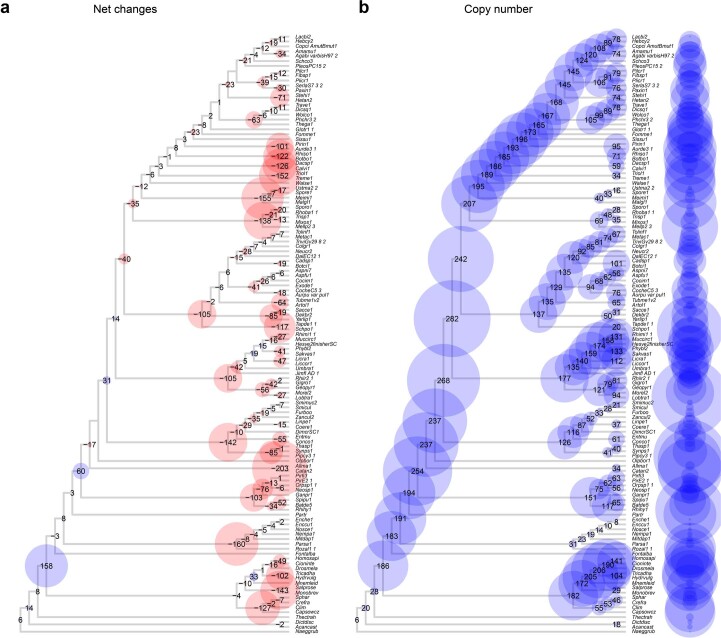
Extended Data Fig. 9. Ancestral copy numbers and evolution of transporters.
a) Net changes (expansion - blue; contraction - red) to ancestral protein coding capacity across the fungal phylogeny. b) inferred ancestral copy numbers. Duplications mapping to terminals (that is species specific paralogs) are not shown. The size of the circles is proportional to the number of net gain events and copy numbers in panel (a) and (b), respectively.

