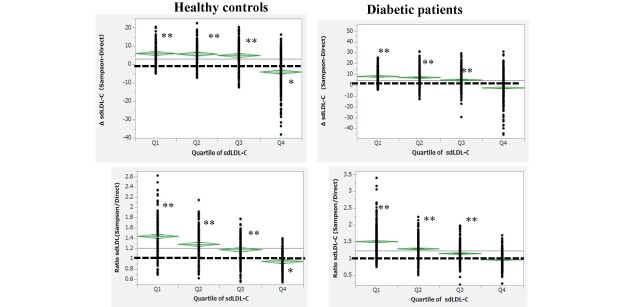
Fig.5. Difference (Δ) or the ratio of sdLDL-C (Sampson vs. direct) stratified by the quartile of direct sdLDL-C concentrations (Q1,2,3,4) in healthy controls and patients with diabetes.
The concentration of direct sdLDL-C was as follows: Q1, 2.4–18.1; Q2, 18.2–23.4; Q3, 23.4–36; and Q4, 36.2–111.6 mg/dl for healthy controls, and Q1, 5.9–21.2; Q2, 21.3–27.9; Q3, 28–39; and Q4, 39.1–117.6 mg/dl for patients with diabetes. ΔsdLDL-C and the ratio of sdLDL-C are all increased with lower quartiles of direct sdLDL-C (p-trend <0.01 estimated using the Jonckheere–Terpstra trend test). *p<0.001 and **p<0.0001 vs. 0 mg/dl for ΔsdLDL and 1 for the ratio of sdLDL-C (paired t-test)

