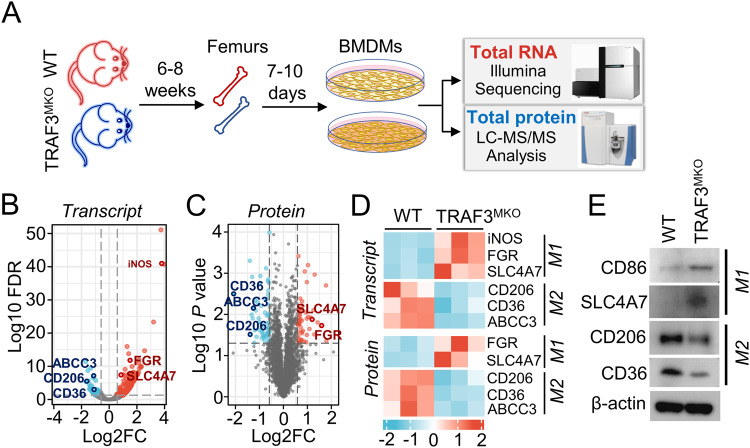
Fig. 1. Combined analysis of transcriptome and proteome revealed TRAF3 regulates M1/M2 macrophage polarization.
A BMDMs were generated by cultivating bone marrow cells isolated from the femurs of 6–8 weeks old WT and TRAF3MKO mice. Total RNA was extracted and RNA-sequencing analysis was performed using Illumina Hiseq2500/X platform. Cell proteome expression profile was analyzed using LC-MS/MS analysis. B Volcano map of RNA-sequencing different expression genes. M1/M2 macrophage marker genes are provided. Fold change >1.5, FDR < 0.05, n = 3 for each group. C Volcano map of proteome expression profile. M1/M2 macrophage markers are provided. Fold change >1.5, p < 0.05, n = 3 for each group. D Heat map of M1/M2 macrophage marker gene mRNA and protein levels in WT and TRAF3MKO BMDMs. E BMDMs were harvested and lysed with RIPA buffer. Immunoblotting assays were performed to analyze M1 and M2 marker expression.

