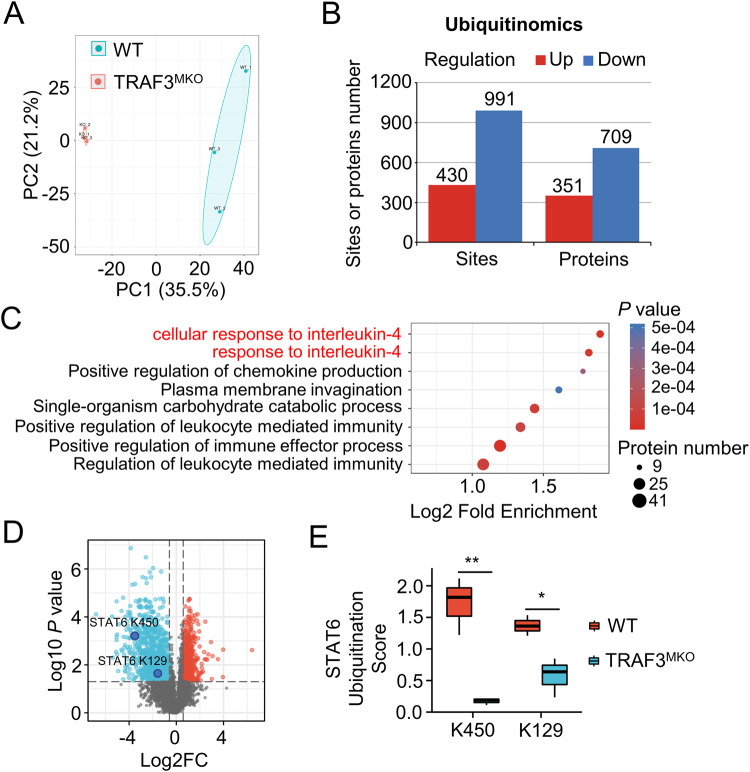
Fig. 3. Quantitative ubiquitomics assays demonstrated that TRAF3 regulates IL-4 pathway.
BMDMs from WT and TRAF3MKO mice were treated with MG132 for 2 h before harvest and quantitative ubiquitomics assays were performed. A Principal component analysis (PCA) was done to evaluate the quantitative repeatability of ubiquitination modification. B Bar graph shows the significant different proteins or sites number of ubiquitin modification. Regulation means TRAF3MKO/WT up-regulated or down-regulated. Fold change >1.5, p < 0.05. C Functional enrichment of Gene Ontology (GO) analysis of biological process was done based on down-regulated ubiquitination modifying protein. For each category, a two-tailed Fisher’s exact test was employed to test the enrichment of the differentially modified protein against all identified proteins. The GO with a corrected p value < 0.05 is considered significant. D Volcano map of ubiquitin-modified sites profile. Blue, TRAF3MKO/WT down-regulated sites; red, TRAF3MKO/WT up-regulated sites. Fold change >1.5, p < 0.05, n = 3 for each group. E STAT6 K450 and K129 residue ubiquitination scores in WT and TRAF3MKO BMDMs. Student’s t test, *p < 0.05, **p < 0.01, n = 3 for each group.

