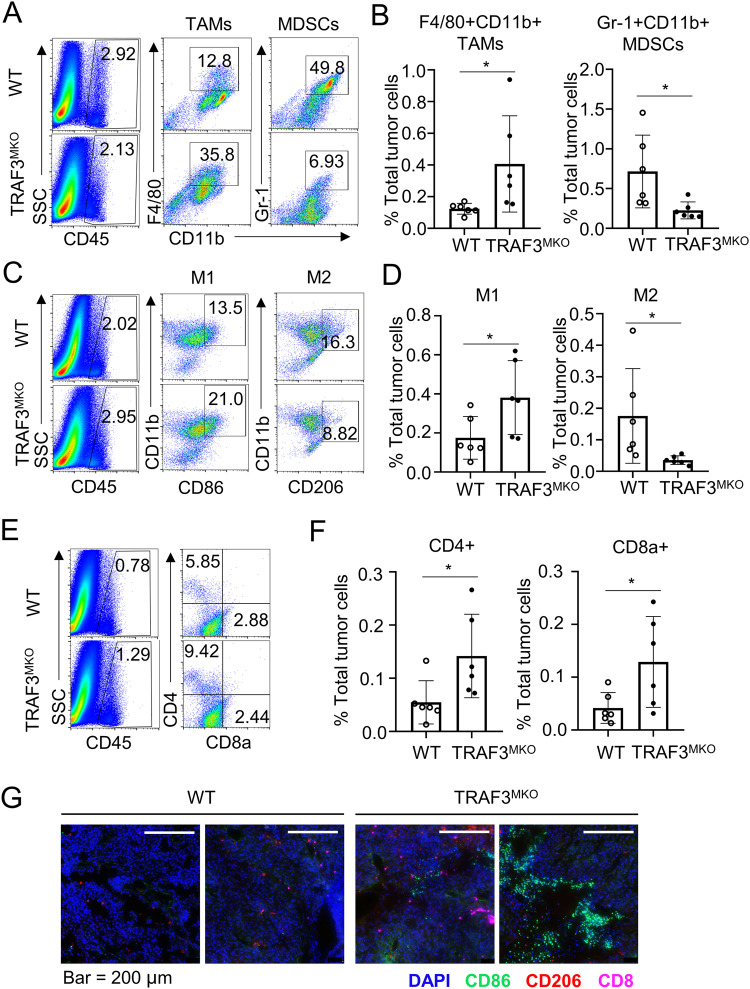
Fig. 7. TRAF3 regulates immune cell infiltration in B16 tumor model.
Flow cytometric analysis of immune cells (CD45+) infiltrated to day 21 tumor tissues. A Frequency of tumor infiltrated F4/80+CD11b+ TAMs and Gr-1+CD11b+ MDSCs. B Summary of flow cytometry data of (A) based on multiple mice, showing the frequency of the indicated cell populations within total tumor cells. C Frequency of tumor infiltrated CD86+CD11b+ M1 TAMs and CD206+CD11b+ M2 TAMs. D Summary of flow cytometry data of (C) based on multiple mice. E Frequency of tumor infiltrated CD4+ T cells and CD8a+ T cells. F Summary of flow cytometry data of (E) based on multiple mice. G Multiplexed immunofluorescence staining of infiltrating immune cells in B16 tumor tissue. Presentative images are shown. Bar = 200 μm. CD8, pink; CD86, green; CD206, red. Data are represented as mean ± SD. Each panel is a representative experiment of at least three independent biological replicates. Student’s t test, *p < 0.05, n = 6 for each group.

