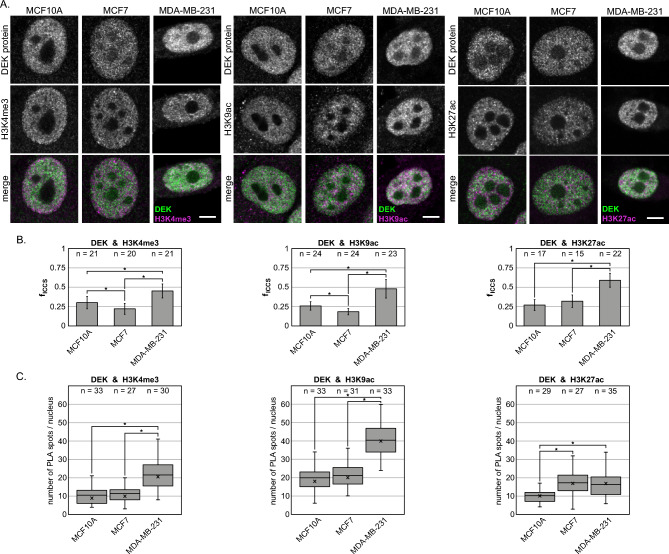
Figure 2.
Correlation between DEK protein distribution and active chromatin regions in human breast cancer model. (A) Confocal images of co-immunostained breast cancer model cell lines with DEK protein and H3K4me3, H3K9ac or H3K27ac histone modifications. Scale bars = 5 μm. (B) Column bar graphs representing means of colocalized fractions extracted from ICCS analysis. (C) Box plot graphs of the PLA spots quantitative analysis. For (B) and (C) statistical significance between all groups (p < 0.0167, marked with an asterisk symbol) was determined by one-way ANOVA with Bonferroni post-hoc test.

