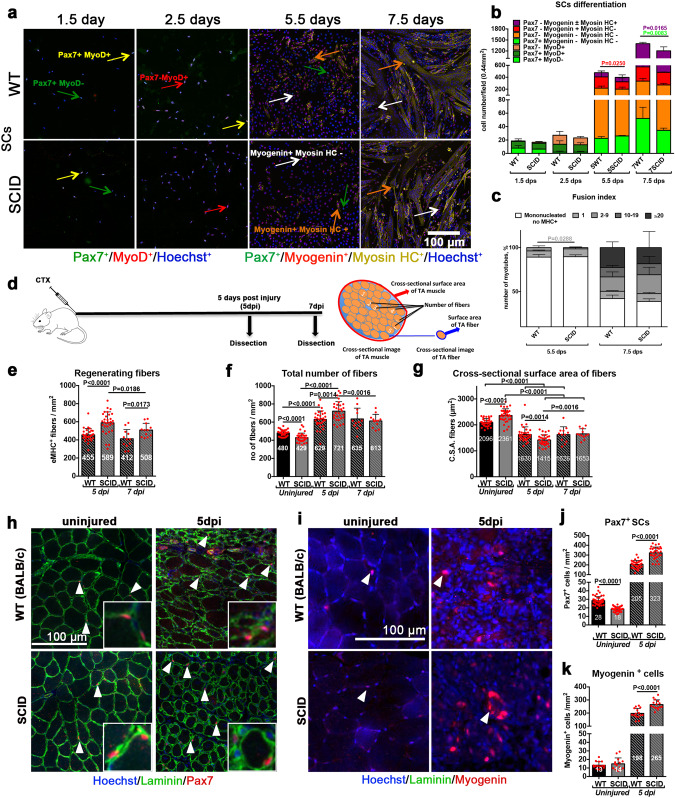
Fig. 4. Delayed SC differentiation in SCID mice results in altered muscle composition during regeneration.
a–c SCs isolated from SCID and the corresponding WT mice. a Immunofluorescent labeling of WT or SCID SC-derived myogenic cells with: Pax7 (green), MyoD (red), Myogenin (red), and MHC (yellow); nuclei are counterstained with Hoechst (blue). Pax7+ cells are indicated with a green arrow, MyoD+ cells with a red arrow, Myogenin+ cells with a white arrow, and MHC+ cells with an orange arrow. b Histograms of myogenic differentiation of SC derived from WT and SCID mice. Combination of myogenic markers reveals several myogenic or differentiated subpopulations, indicated in the legend of the histogram, and displayed with increasing differentiation level from bottom to top. n = 3–4 mice, 5–10 fields/condition, mean ± SD. Significance by Mann–Whitney test, P values indicated on the histogram. c Fusion index 5.5 and 7.5 days post seeding. The number of nuclei/structures have been arbitrarily defined and vary from 0 to >20. Sixty-seven then 789 MHC+ cells/0.44 mm2 in SCID mice, and 73 then 870 MHC+ cells/0.44 mm2 in WT mice at 5.5 dps and 7.5 dps, respectively. n = 3–4 mice, 5000 nuclei/condition, mean ± SD. Significance by Mann–Whitney test, P values are indicated on the histogram. d–h In vivo TA muscle regeneration in WT and SCID mice 5 and 7 dpi. d Experimental scheme: 10 µM of cardiotoxin injury followed by TA dissection 5 and 7 dpi, along with uninjured TA from the same mouse. Cross-sectional scheme of TA muscle and parameters measured are shown. Histograms of e number of regenerating eMHC+ fibers/mm2, f number of total fibers/mm2, and g cross-sectional surface area (CSA) of fibers on TA sections. The CSA of the fibers is a measure of their size (thickness), obtained by dividing the TA surface by the number of fibers. Representative images of e, f and g are shown in Fig. S5a. Representative images of h Pax7+ SCs (in red) and i Myogenin+ differentiating cells (in red), indicated with arrowheads on uninjured and 5 dpi TA sections. Quantification of j Pax7+ SCs/mm2 and k Myogenin+ cells/mm2 on uninjured and 5 dpi TA sections. n = 3 mice, 10 sections/condition, mean ± SD. Significant P values between conditions by Mann–Whitney test are indicated on the histograms.

