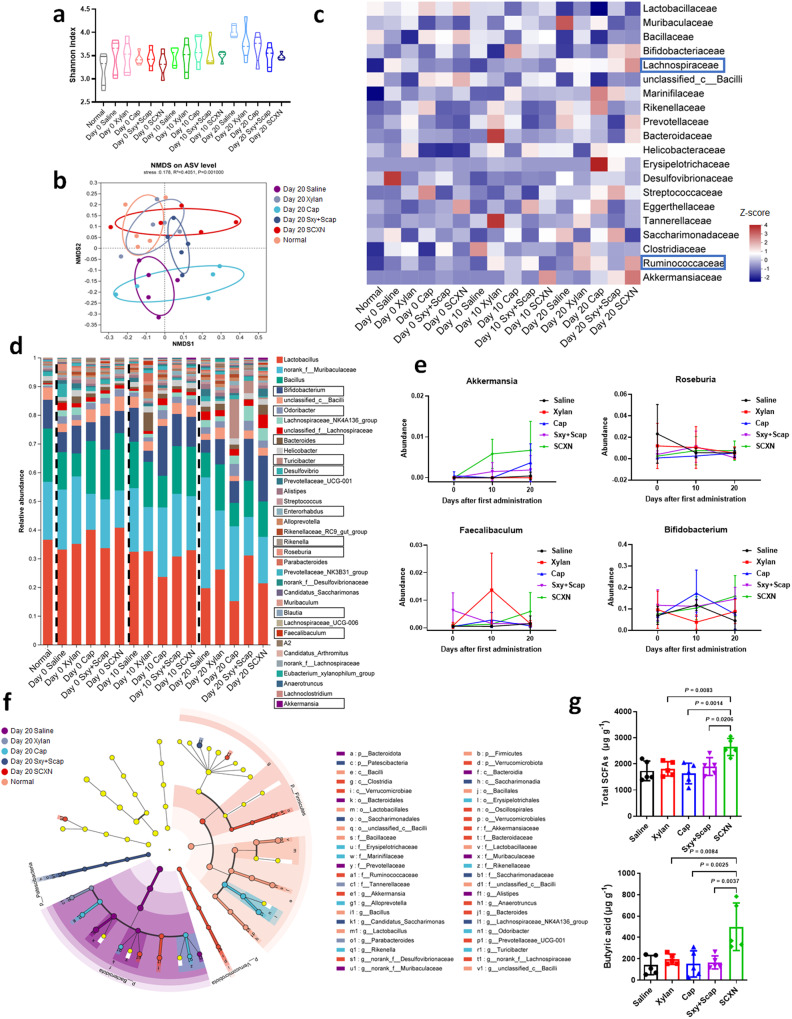
Fig. 7. Regulating gut microbiota by SCXN.
CT-26 tumor-bearing mice were treated with different formulations for 20 d and fecal samples were collected for 16 S rDNA sequencing before (Day 0), in the middle of (Day 10), and at the end of (Day 20) the treatment. a Microbial α-diversity in terms of Shannon index at the ASV level. b Microbial β-diversity NMDS analysis based on Bray-Curtis distance at the ASV level at the end of the treatment. c Heatmap showing relative abundance of the gut microbiota at the family level (displayed as normalized Z-score). d Barplot showing relative abundance of the gut microbiota at the genus level. e Change of the relative abundance of Akkermansia, Roseburia, Fecalibaculum, and Bifidobacterium during 20-day treatment process. f LefSe analysis cladogram representing the significantly different taxas between different groups from phylum to genus levels at the end of the treatment (LDA > 2, p < 0.05). g Summary of fecal SCFA levels and butyric levels in feces from CT26 tumor-bearing mice after different treatments. Data represent the mean ± SD (n = 5 mice). Statistical significance was calculated using one-way ANOVA with Tukey’s multiple comparisons test. Source data are provided as a Source Data file.

