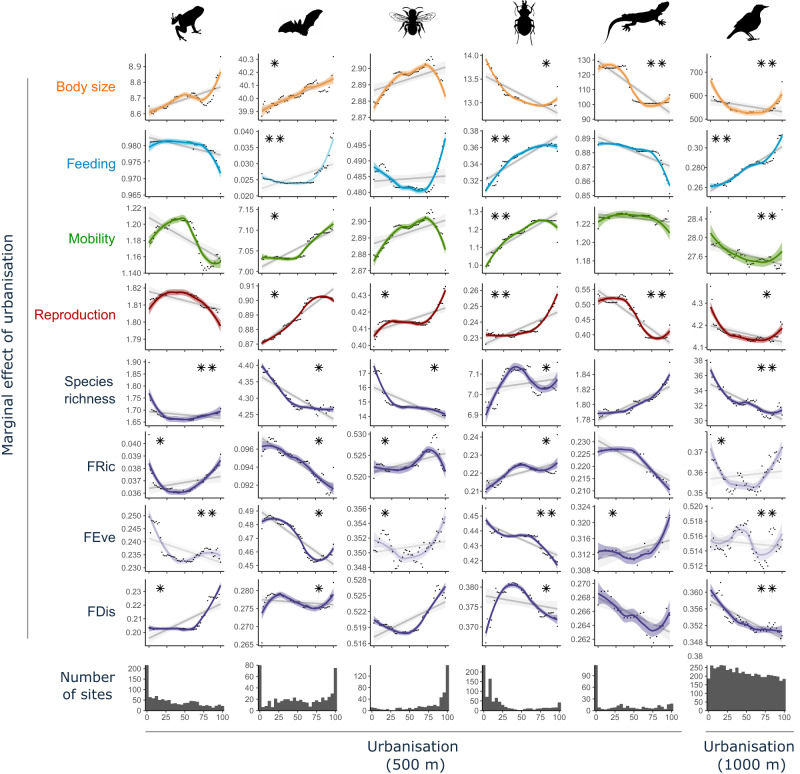
Fig. 2. Predicted changes in trait values per taxon along an urbanisation gradient.
Partial dependence plots showing the urbanisation-induced shifts in community functional metrics for six taxonomic groups. The partial dependence plots summarise the marginal effect that urbanisation (x-axis = percentage of urbanised area in a 500 m radius around the sampling plot; or 1000 m for birds) has on the predicted values of each community-level trait (i.e. effect of urbanisation when climate, latitude and forest cover are kept constant). The y-axes reflect the range of predicted values for each response variable (community-weighted mean trait values and diversity metrics) and are not zeroed so care should be taken when interpreting the magnitude of change. The fitted colour lines and 95% confidence bands around predicted values are from Local Polynomial Regression (LOESS). The grey lines and 95% confidence bands around predicted values (light grey) are from linear regressions based on the same data to indicate direction of trend. Trait definitions are provided in Supplementary Table 3 (briefly, Feeding: high values = generalist diet except for bats where feeding represents different hunting strategy; Mobility: high values = higher mobility; Reproduction: amphibians, birds and reptile = clutch size / other taxa = reproduction strategy). Note that for bees, the inter-tegula distance was used for body size and mobility, and therefore the model presented is the same for both traits. Functional dispersion (FDis), functional richness (FRic) and functional evenness (FEve) are defined in the method section in “Functional composition of animal communities” (see also Supplementary Fig. 2). Transparent shade represents models with <10% variance explained. Stars show the contribution of urbanisation to the overall model (* 20-50%; ** > 50%). Additional information on each models’ overall predictive power and the contribution of the percentage of urban land cover can be found in Table 1. Image credits: Ghedo and T. Michael Keesey (https://creativecommons.org/licenses/by-sa/3.0/) for reptile. Michael Keesey (vectorization); Thorsten Assmann, Jörn Buse, Claudia Drees, Ariel-Leib-Leonid Friedman, Tal Levanony, Andrea Matern, Anika Timm, and David W. Wrase (photography) (https://creativecommons.org/licenses/by/3.0) for carabid beetle. All other silhouette images come from www.phylopic.org and are public domain images.

