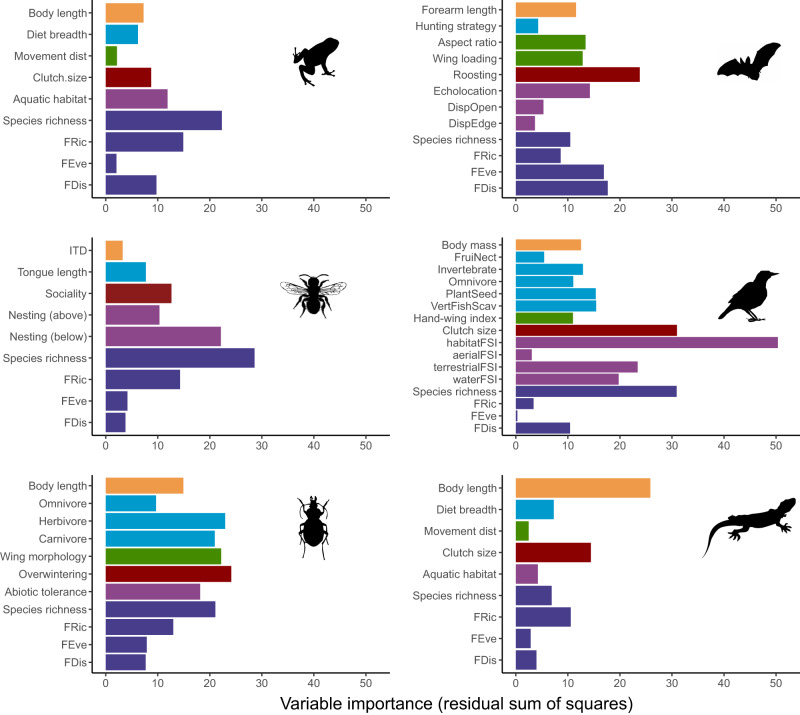
Fig. 3. Relative importance of the extent and aggregation of urban land cover as predictors of community means (colours show the different trait categories; Supplementary Table 3) and variability (FDis = functional dispersion, FRic = functional richness, and FEve = functional evenness; dark blue) of traits as well as species richness for each taxonomic group.
Variable importance was estimated using the residual sum of squares from random forests models. Average variable importance values weighted by the R2 of the test set of each individual model were computed to estimate urban land cover variable importance for each metric of community-weighted means and variability of traits. Longer bars indicate traits or functional diversity measures that are better predicted by urban land cover within the surrounding landscape. Image credits: Idem Fig. 2.

