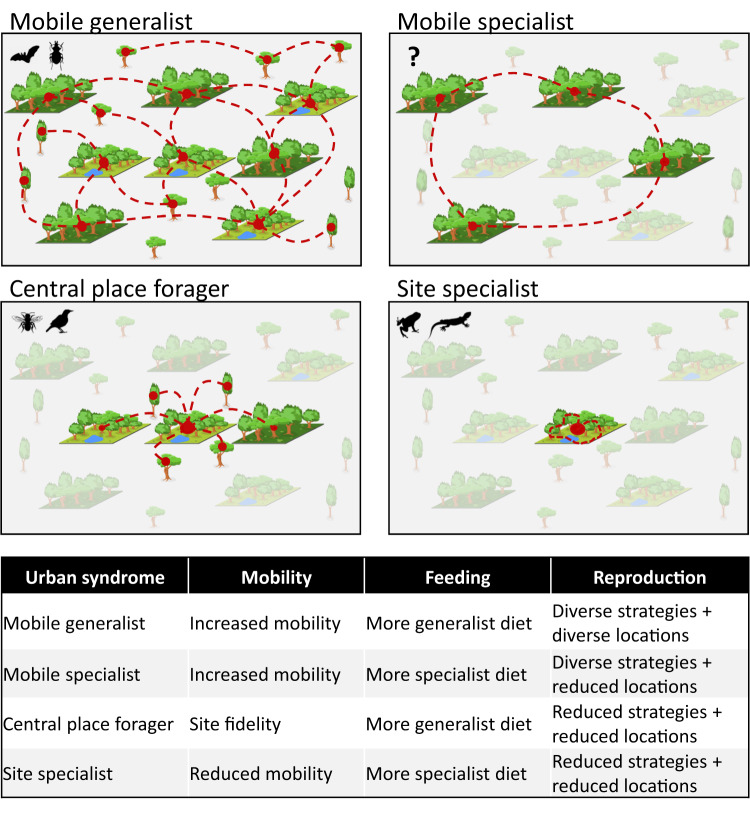
Fig. 5. Simplified representation of the four urban trait syndromes.
Two types of green habitat patches with different resources are represented in an otherwise mostly unsuitable urban matrix. Grey patches represent green habitats that are unusable for a specific taxon. Red dashed lines show typical movement pattern of taxa among patches. The landscapes of Fig. 5 and their individual elements were created by Bertrand Fournier using the basic set of tools available in the vector graphics open source software “Inkscape 1.2.2”. No previously-created elements were used. No images from a database were used. The landscapes of Fig. 5 and their individual elements were not published elsewhere. Image credits for taxa silhouettes: Idem Fig. 2.

