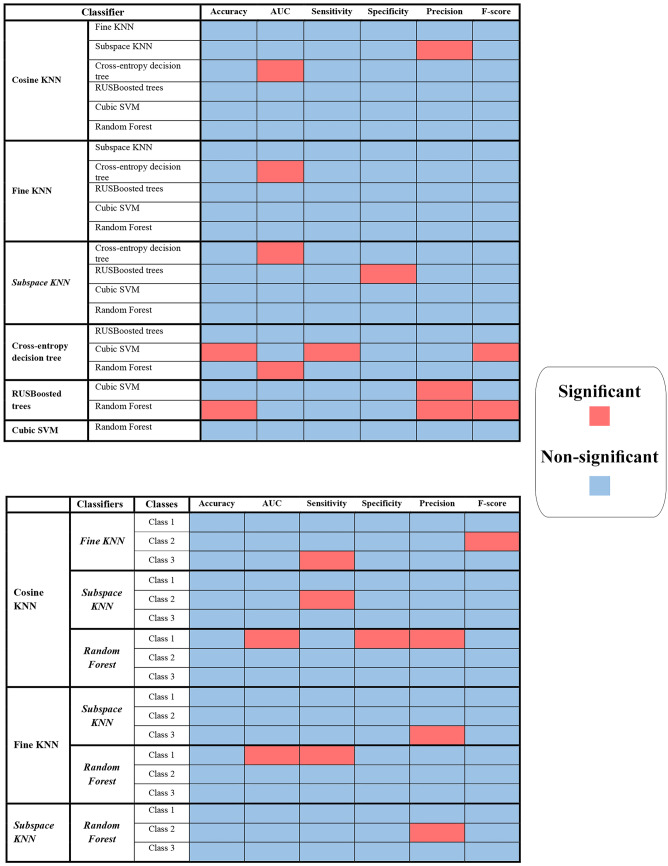
Fig. 7.
Comparison of the performance of seven classifiers based on the NCA feature selection method using the Wilcoxon rank-sum test. The top panel illustrates the p-values obtained from comparing the evaluation metrics of seven classifiers, including accuracy, AUC, sensitivity, specificity, precision, and F-score. The lower panel displays the p values obtained from comparing the top four classifiers based on their evaluation metrics, compared on a per-class basis

