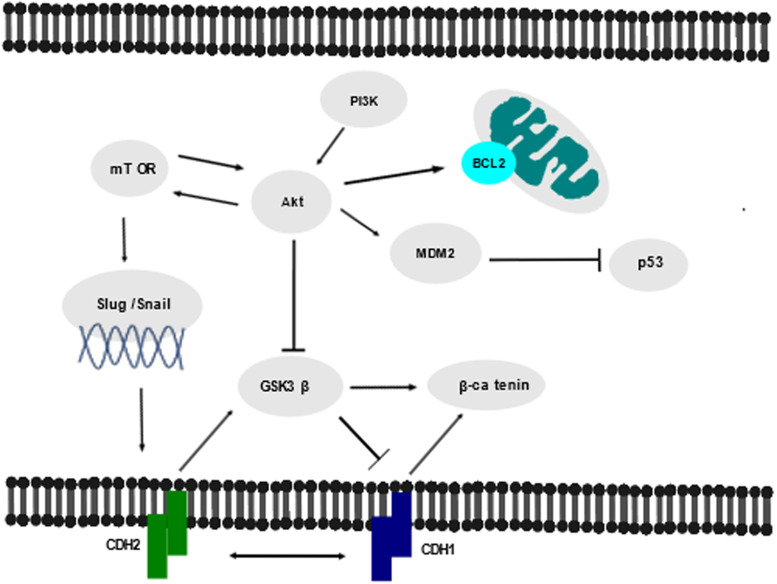
Figure 2.
Schematic diagram of the pathways and transcription factors associated with CDH2, including the PI3K/Akt/mTOR pathway and the Wnt/β-catenin pathway. Arrows represent activation; bars represent inhibition, double-ended arrows in the pathway indicate upregulation of a molecule results in downregulation of the other and vice versa. Adapted from Refs 71, 72, 73, 74, 85.

