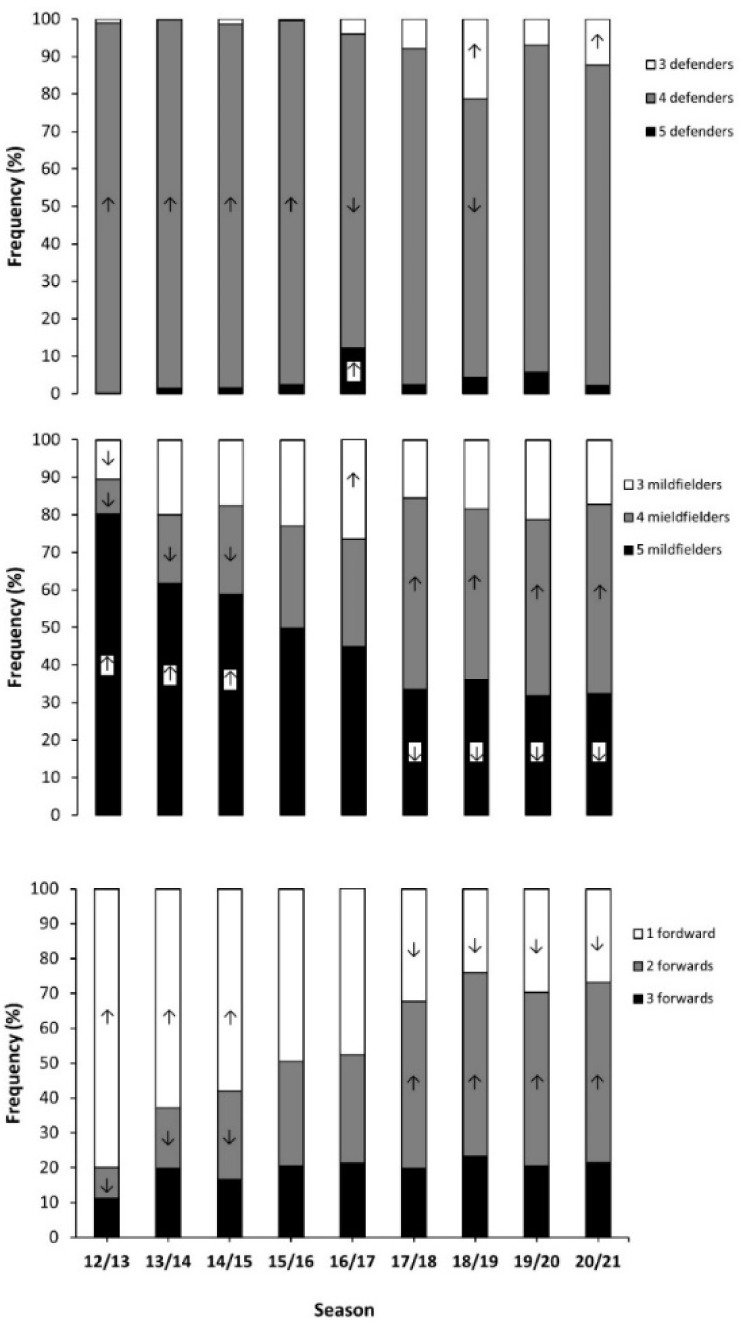
Figure 2.

Distribution of teams’ formations at the beginning of the match in LaLiga according to the number of players in each line.
Data are frequencies of team formations depending on the number of players per line within the same season. ↑ indicates that the selection of the number of players in each line was higher than expected in that season at p < 0.05. ↓ indicates that the selection of the number of players in each line was lower than expected in that season at p < 0.05.
