Figure 2.
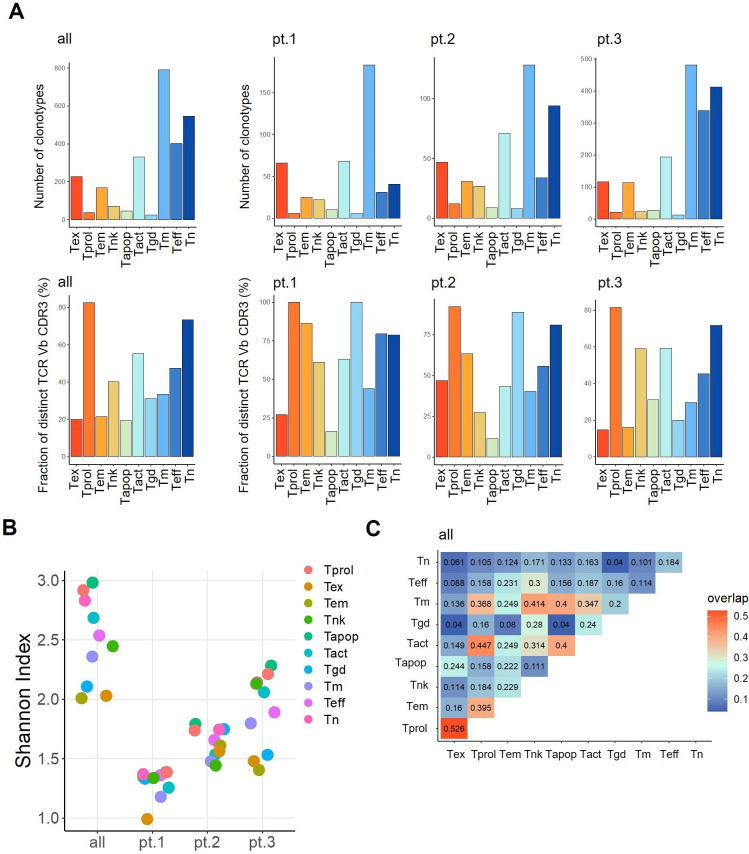
TCR repertoire analysis in each CD8+ T-cell cluster. (A) The number of unique clonotypes (upper) and the fraction of T cells that express distinct complementarity-determining region 3β (number of clonotypes/number of clones) (lower) in each cluster in all patients (left) and in each patient (right). (B) Shannon Diversity Indexes in 10 clusters. (C) The rate of overlapping clonotypes among different clusters. Tact, activated T; TCR, T-cell receptor; Tem, effector memory T; Tex, exhausted T; Tm, memory T; Tn, naive T; Tprol, proliferating T; Teff, effector like T; Tgd, γδ-like T; Tapop, apoptotic T.

