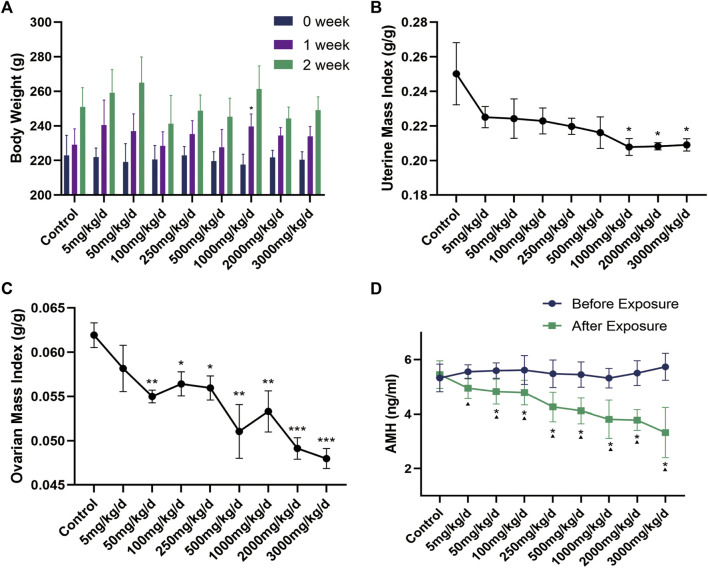
FIGURE 3.
(A) Changes in body weight of rats in each group (n = 6) during DEHP gavage (g); (B–C) Changes in the mass index of the uterus and ovary in rats after DEHP exposure; (D) Changes in serum AMH levels in the rats of each group. Note: *: p < 0.05, **: p < 0.01, ***: p < 0.001, p-value compared with the control group after the experiment. ▲: p < 0.05, p-value before and after the experiment in the same treatment group. AMH: anti-Müllerian hormone.

