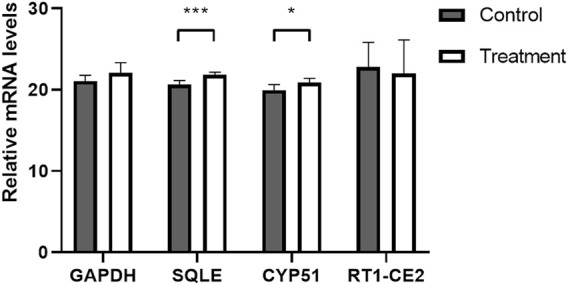
FIGURE 9.

Expression of ovarian related genes in control and 5 mg/kg/d treatment group. Note: *: p < 0.05, ***: p < 0.001, p-value compared with the control group. GAPDH: Glyceraldehyde-3-phosphate dehydrogenase; CYP51: cytochrome P450 family 51; SQLE: squalene epoxidase; RT1-CE2:RT1 class I, locus CE2.
