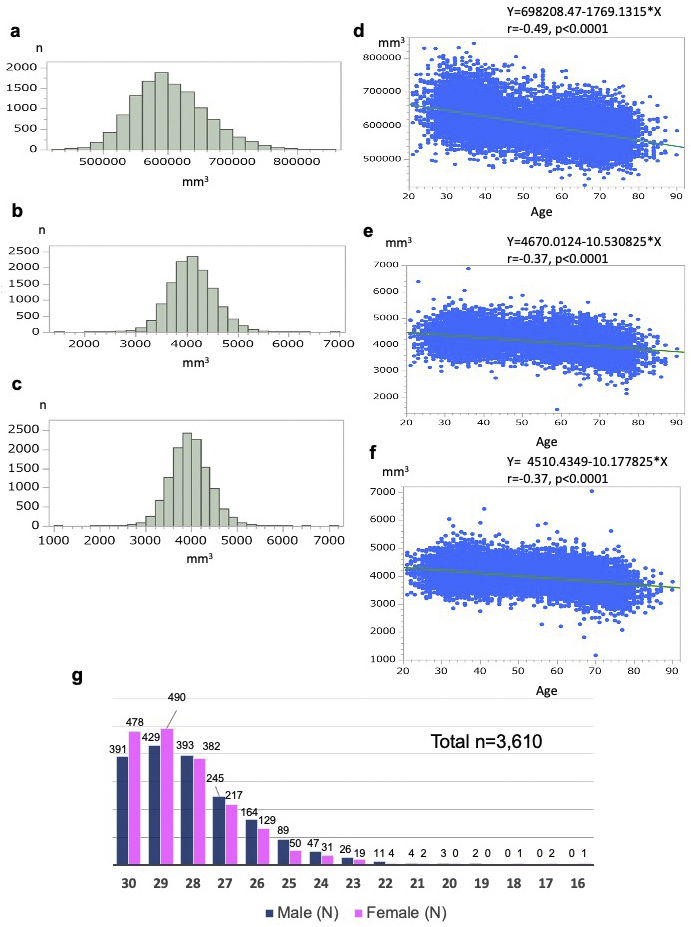
Figure 10.

Preliminary analyses of brain morphometry and cognitive function.
a-f. These figures present the distribution of anatomical volumes and the correlation between anatomical volume and age for 12,164 participants in the Brain MRI Study. a, d. Each figure presents the relationship between total gray matter volume and age. b e. Each figure presents the relationship between left hippocampal volume and age. c, f. Each figure presents the relationship between right hippocampal volume and age. Pearson’s correlation analysis was conducted to evaluate the correlation between anatomical volume and age. g. The figure presents the distribution of MMSE-J (Mini-Mental State Examination, Japanese version) scores (total and by sex), as well as the number and percentage of individuals scoring below the normal range.
