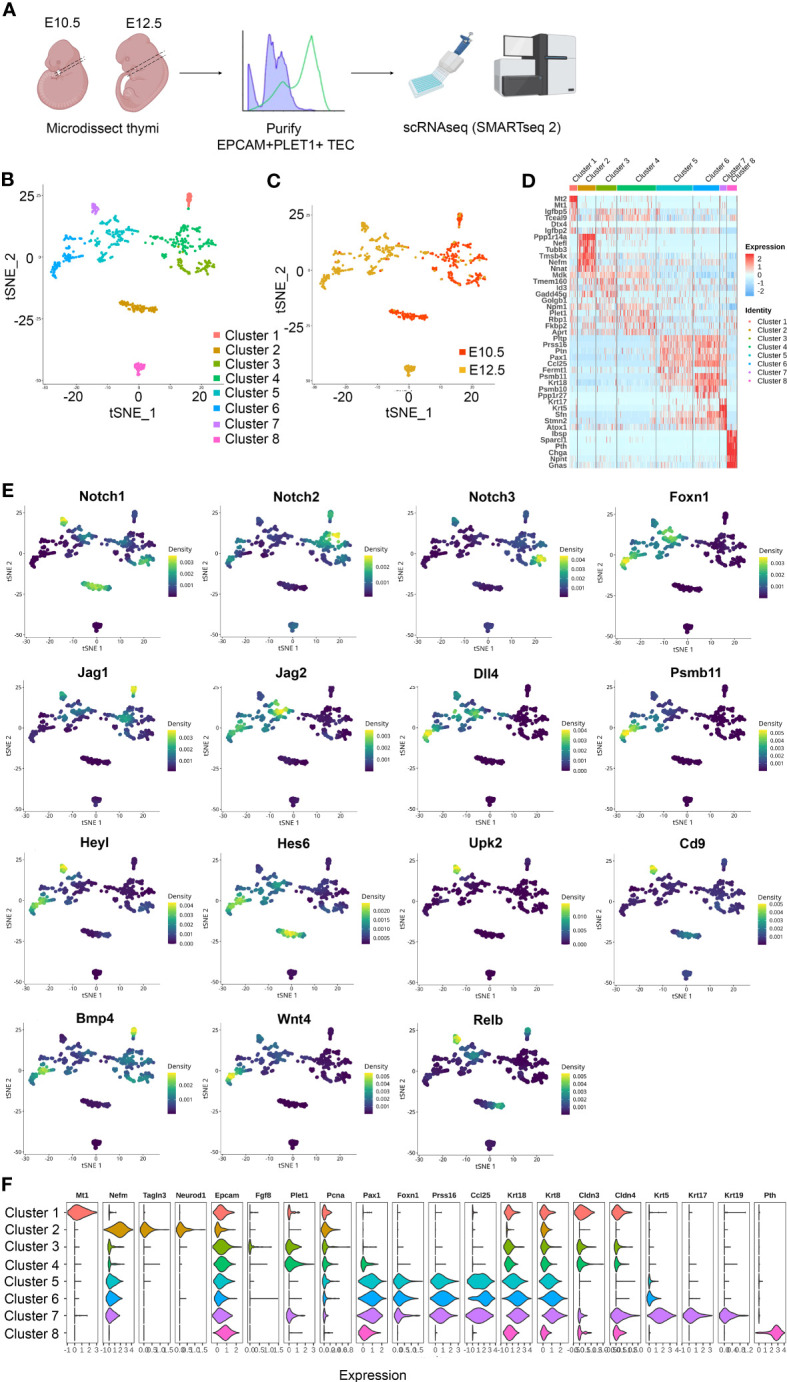
Figure 1.

Heterogeneity of EPCAM+PLET1+ cells in the E10.5 and E12.5 thymic primordium. (A) Schematic showing experimental design. Thymic primordia were microdissected from E10.5 and E12.5 wild-type embryos and dissociated to single cell suspensions. Single E10.5 and E12.5 EPCAM+PLET1+ TEC were then deposited into BD Precise WTA Single Cell Encoding plates by flow cytometry processed for single cell transcriptome sequencing using BD Precise WTA reagents. (B, C) tSNE visualizing the clustering results with Seurat colored by cluster (B) and developmental stage (C) (n=709 cells). (D) Heat map showing differentially expressed genes among the eight clusters. (E) Expression of Notch signalling related plus selected other genes across all clusters. (F) Violin plot showing expression of selected markers across all clusters.
