Figure 2.
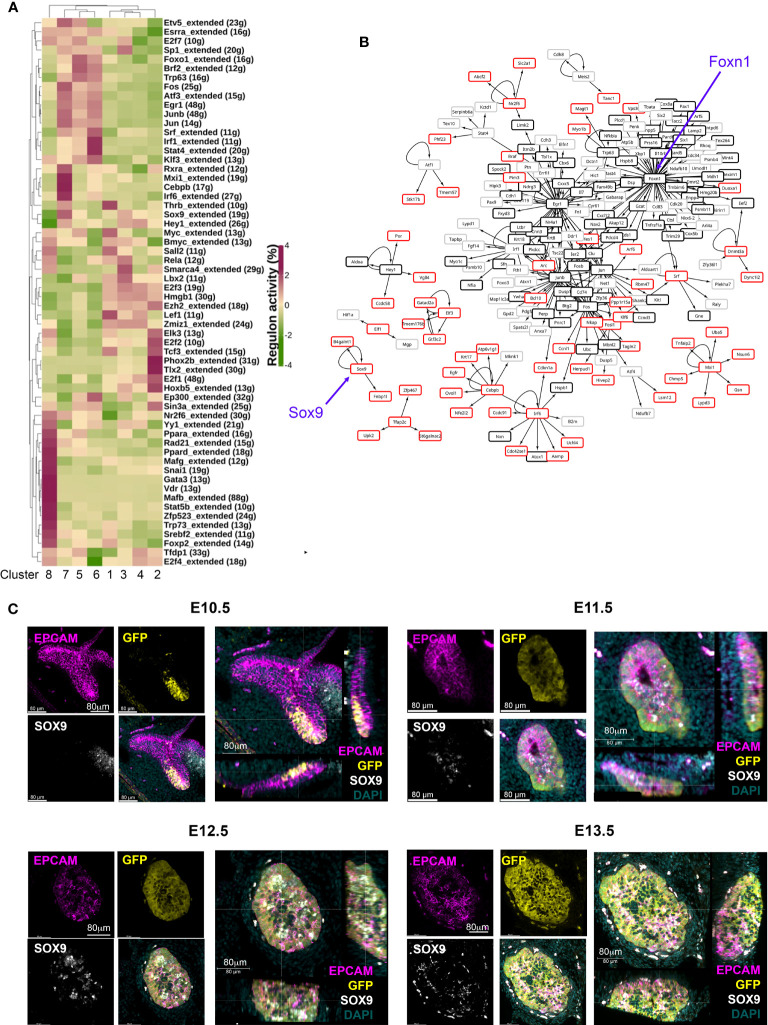
Identification of candidate regulatory networks in E10.5 and E12.5 TEC. (A) Heat map shows SCENIC scores of transcription factors relevant to each cluster. (B) Network constructed with regulons and their control targets. Arrows indicate control relationships. Red boxes show genes upregulated in Cluster 7 but not in Cluster 5 or 6. Black boxes show genes expressed in all E12.5 TEC clusters. Grey boxes show genes upregulated in E12.5 Clusters 5 and 6 compared to Cluster 7. Blue arrows highlight Sox9 and Foxn1 nodes. (C) Images show wholemount immunostaining of thick transverse sections of the pharyngeal region containing the thymic primordia from Foxn1GFP embryos at the ages and for the markers shown. Scale bars are as indicated. Note that in the E12.5 and E13.5 images the cells immediately outside the epithelial region that stain with all markers are autofluorescent.

