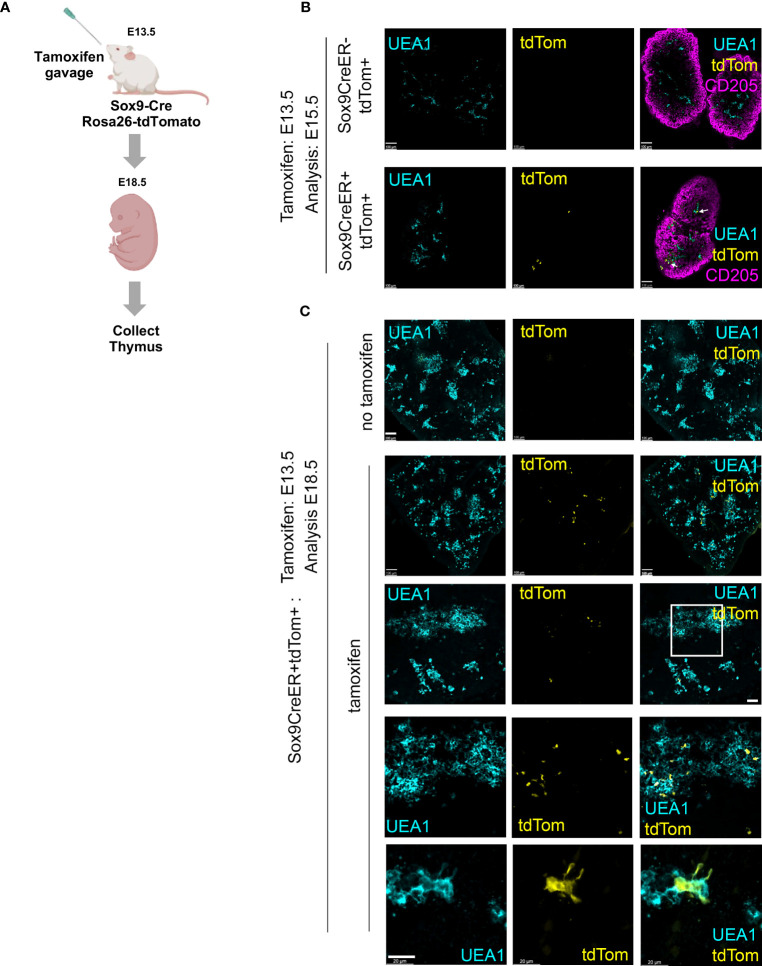
Figure 3.
Lineage tracing demonstrates mTEC restriction of E12.5 and E13.5 Sox9+ TEC (A) Schematic of experimental protocol. Sox9CreER;Rosa26-tdTomato (Ai14) males were crossed with wild type or Sox9CreER;Rosa26-tdTomato female mice to obtain timed matings. The pregnant females were treated with tamoxifen at E13.5. Thymi were collected at E15.5 or E18.5, genotyped and processed for wholemount imaging. (B, C) Images show E15.5 and E18.5 Sox9CreER+;Rosa26-tdTomato+ thymi from tamoxifen-treated and carrier-only treated embryos, after staining for the markers shown. (B, C) Cyan, UEA1; yellow, tdTomato; magenta, CD205. Note, in some samples penetration of αCD205 was poor. Second to bottom row in (C) shows detail from boxed area in row above. Bottom row in (C) high magnification image showing UEA1+tdTom+ cell from another section. Images show optical sections from thick sections or whole thymi. Scale bars all 100μm except C bottom row, which is 20 μm. (B) E15.5, n=3 tamoxifen-treated Sox9CreER+Rosa26-tdTomato+ embryos and n=1 tamoxifen-treated Sox9CreER-Rosa26-tdTomato+ (i.e. CreER negative control) from one pregnant female; E18.5, n=6 tamoxifen-treated Sox9CreER+Rosa26-tdTomato+ embryos from two pregnant female mice set up on different days and n=3 untreated Sox9CreER+Rosa26-tdTomato+ embryos from one pregnant female (negative controls).

