Figure 4.
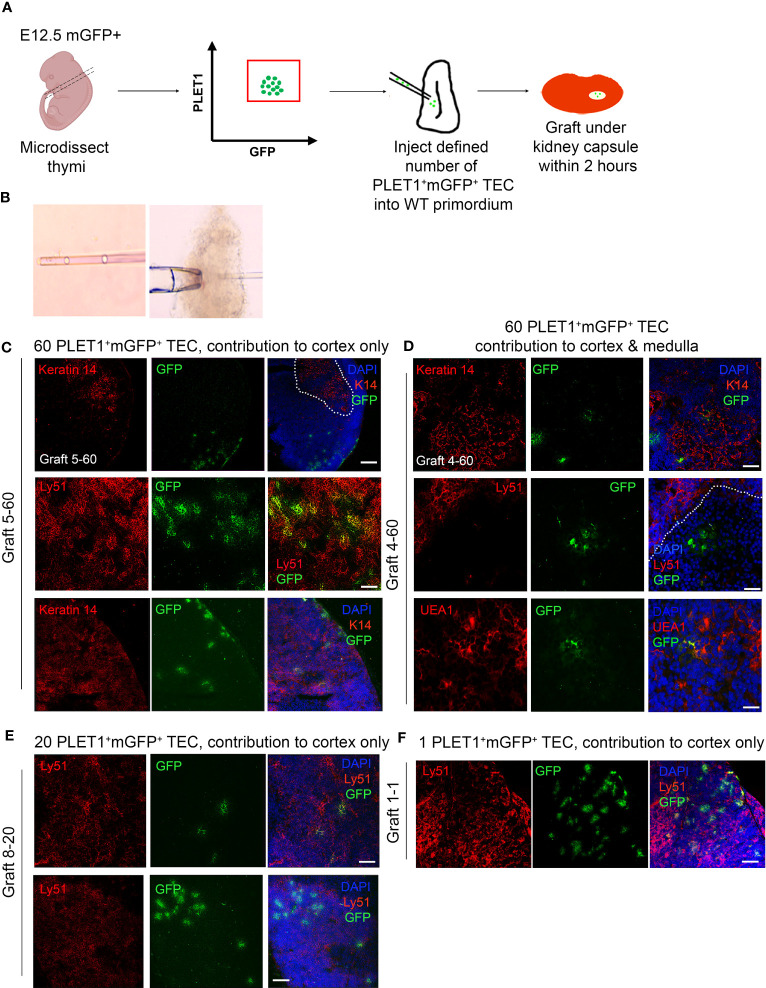
The E12.5 mGFP+ PLET1+ TEC population contains cTEC restricted and common or mTEC restricted progenitors. (A) Schematic showing experiment design. E12.5 mGFP+PLET1+ TEC were isolated from E12.5 thymi, individual cells were picked up in a hand-pulled microinjection pipette. A defined number of mGFP+ TEC was then injected into each wild type E12.5 thymus primordium. The injected primordia were grafted under the kidney capsule of recipient mice on the same day they were microdissected and within 2 hours of microinjection. Grafts were recovered after 2-3 weeks and analysed by histology and immunohistochemical analysis with the markers shown. (B) Images show individual cells within microinjection pipette (left) and E12.5 primordium held with a holding pipette whilst being injected with a microinjection pipette. (C–F) Images show representative staining of cortical (C, E, F) and medullary (D) mGFP+ foci. Sixty (C, D), twenty (E) or one (F) cells were injected per lobe. Cytokeratin 14 (K14) and UEA1 stain mTEC while Ly51 stains cTEC. DAPI reveals nuclei and can be used to differentiate cortical and medullary regions based on cell density. Scale bars 55μm, except C upper row, E lower row and F where scale bars represent 150μm. Graft names correspond to those in Table 1 . Images show single optical sections. Dotted line in (C) top row demarcates medullary area. n for each condition represents an independent graft and is as indicated in Table 1 ; at least three biologically independent replicates were performed for each injection condition.

