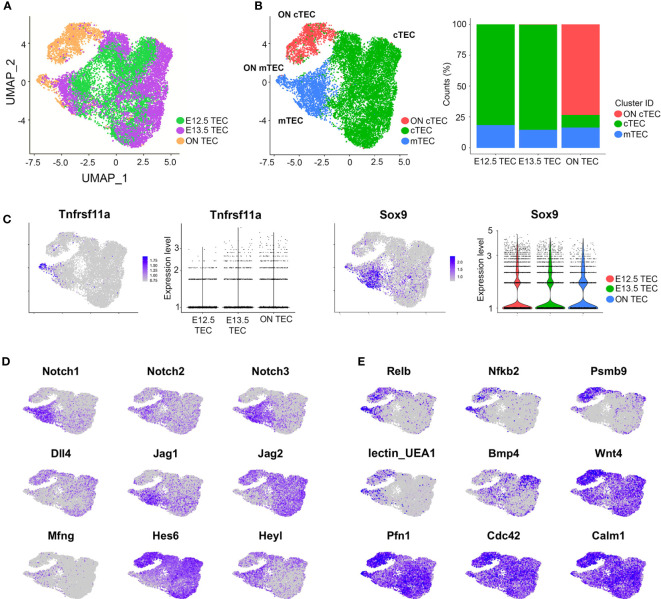
Figure 7.
Single-cell transcriptomics reveal pathways active in overnight culture TEC (ON TEC). (A, B) UMAP plot of E12.5, E13.5 and ON TEC with cells colored by time point (A) or by cluster, with percentages of cells belonging to each cluster (B). (C) Expression levels of the mTEC marker Tnfrsf11a and the early mTEPC marker Sox9 are similar in ON TEC and E13.5 TEC. (D) Notch signaling genes have similar expression in ON TEC. (E) The canonical NF-κB targets, Relb, Nfkb2 and Psmb9, are higher in ON TEC (top row). High UEA1 fluorescence (lectin_UEA1) suggesting a mixed phenotype (middle row). Wnt target genes, Pfn1, Cdc42 and Calm1, are expressed more highly in ON TEC (bottom row and Supplementary Tables 4, 5 ).

