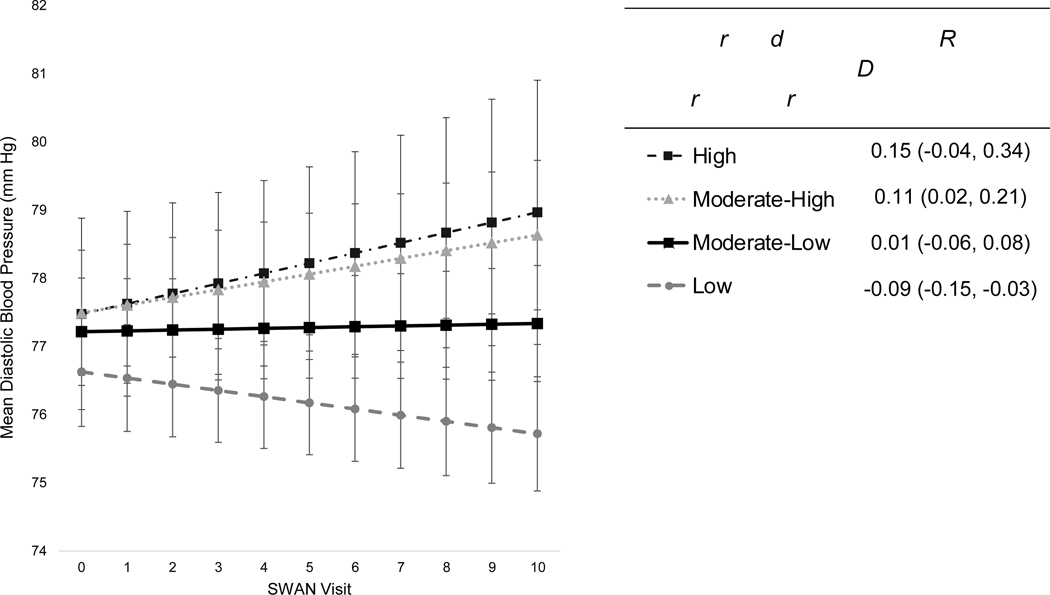
Figure 4.
Trajectories of diastolic blood pressure change (mmHg) per latent neighborhood profile of residence throughout midlifea (n=2,736 women, n=16,900 observations): the Study of Women’s Health Across the Nation, United States (1996–2007).
Abbreviations: DBP, diastolic blood pressure; CI, confidence interval;
aPredicted mean DBP levels (mmHg), and annual rates of DBP change (95% CI), by latent neighborhood profile of residence throughout midlife, as estimated from linear mixed-effect models adjusted for baseline age, race/ethnicity, site, education level, marital status, employment status, alcohol use, current smoking, depressive symptoms, physical activity score, menopausal status, ever use of hormone therapy, and obesity. Note: SWAN visits V00-V10 were conducted at approximately yearly intervals starting in 1996 at baseline (V00) through ten-year follow-up (V10).

